Six years on, the world’s major attractions have regained 96% of their pre-pandemic attendance, with the last year of big gains in 2023. On a fixed-cohort basis, theme parks sit at 97%, museums at 97% and water parks at 93–94%.
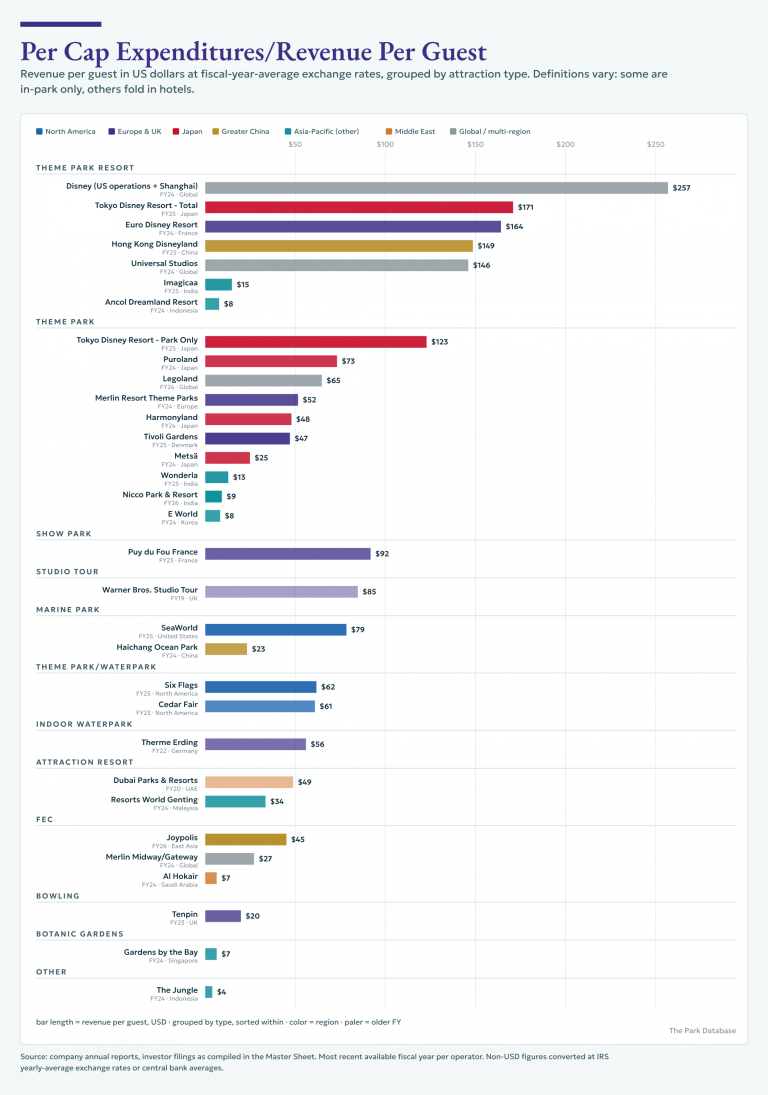
As with all aggregate statistics, these hide important patterns. Attendance is only half the topline number; this is no truer than at Disney and Universal. The 16 megaparks are at 94% globally and 87% in North America, essentially flat for three years, while the other 54 operators in the cohort are at 102%, and crossed their pre-pandemic visitation in 2023. That split is deliberate: the majors have pushed yield (reservations, tiered pricing, paid line-skipping), trading volume for per-capita spend.
Regional disparities: China is the fastest growing market in terms of attendance, North America is the weakest region on every major type. China (including Hong Kong) is an outlier, with theme parks at 116% and museums at 120%, driven by Shanghai Disney (134% of 2019), Hong Kong Disneyland and a museum sector that has expanded capacity; Europe fares better than North America in terms of visitation, with theme parks at 108% and water parks at 107%, carried by Alton Towers, Puy du Fou, Futuroscope and the Uffizi; Latin America is near baseline (theme parks 94%, water parks 107%). North America is a relative laggard in terms of visitation: theme parks 88%, water parks 85%, museums 80% and, unlike everywhere else, it drifted down in 2025. Japan recovered late because its borders reopened late, and now sits at 95% for both theme parks and museums; SE Asia and Oceania remain below 2019 across the board.
Museums also split sharply by geography. Chinese and Taiwanese museums are the strongest single segment in the dataset (Hunan Museum 159%, National Museum of Natural Science 161%, Nanjing 141%), European museums are at 95% with the big London and Italian institutions above 2019 and much of the rest below. North American museums have fallen further behind each year since 2023.
Water parks, which had the shallowest 2020 trough because so many are outdoor and seasonal, have had the flattest recovery since and were the only type where China is well below 2019 (76%).
Notes: Posted 10/2026. Attendance data drawn from TEA GEI data and internal TPDB sources. Access to this dataset is here.