$295.00
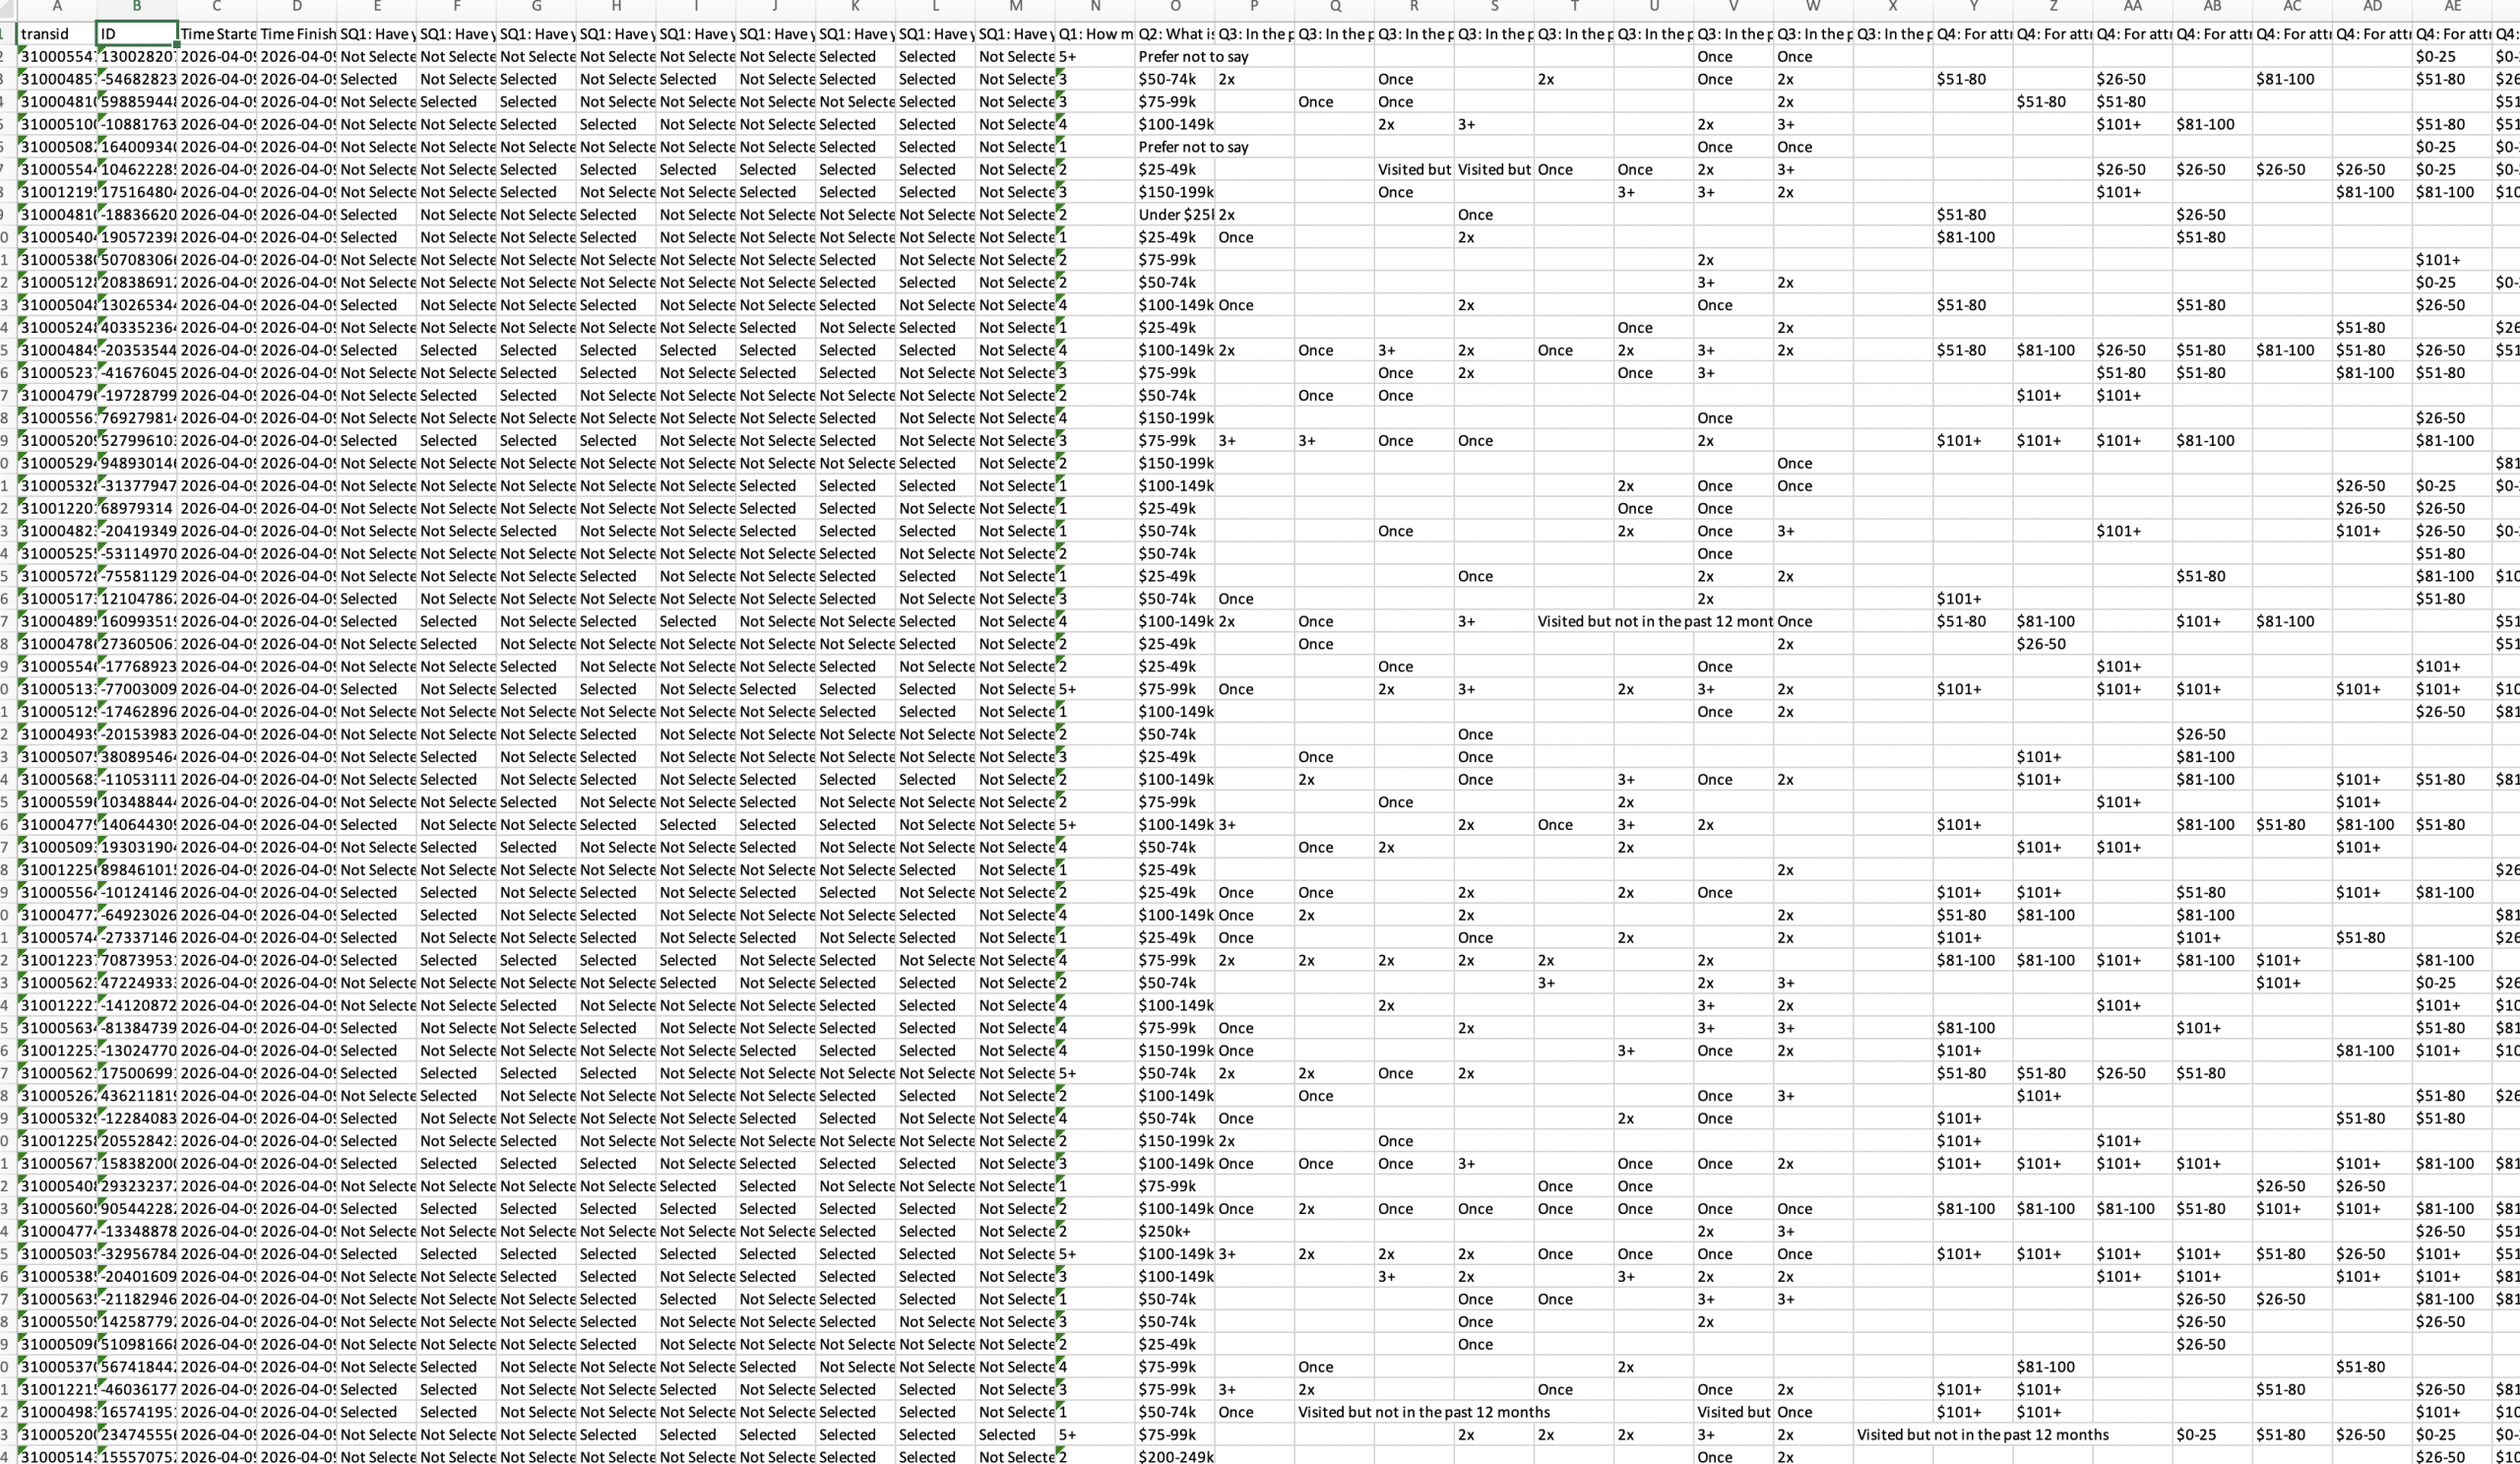
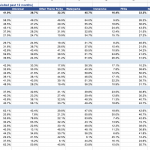
The product includes a fully open Excel workbook with individual-level responses, and a pre-built Summary tab with weighted cross-tabulations across five demographic dimensions. The data is structured, weighted, and modeling-ready: easy to upload into Power BI, Tableau, Python/R, AI tools, or your own strategic planning framework.
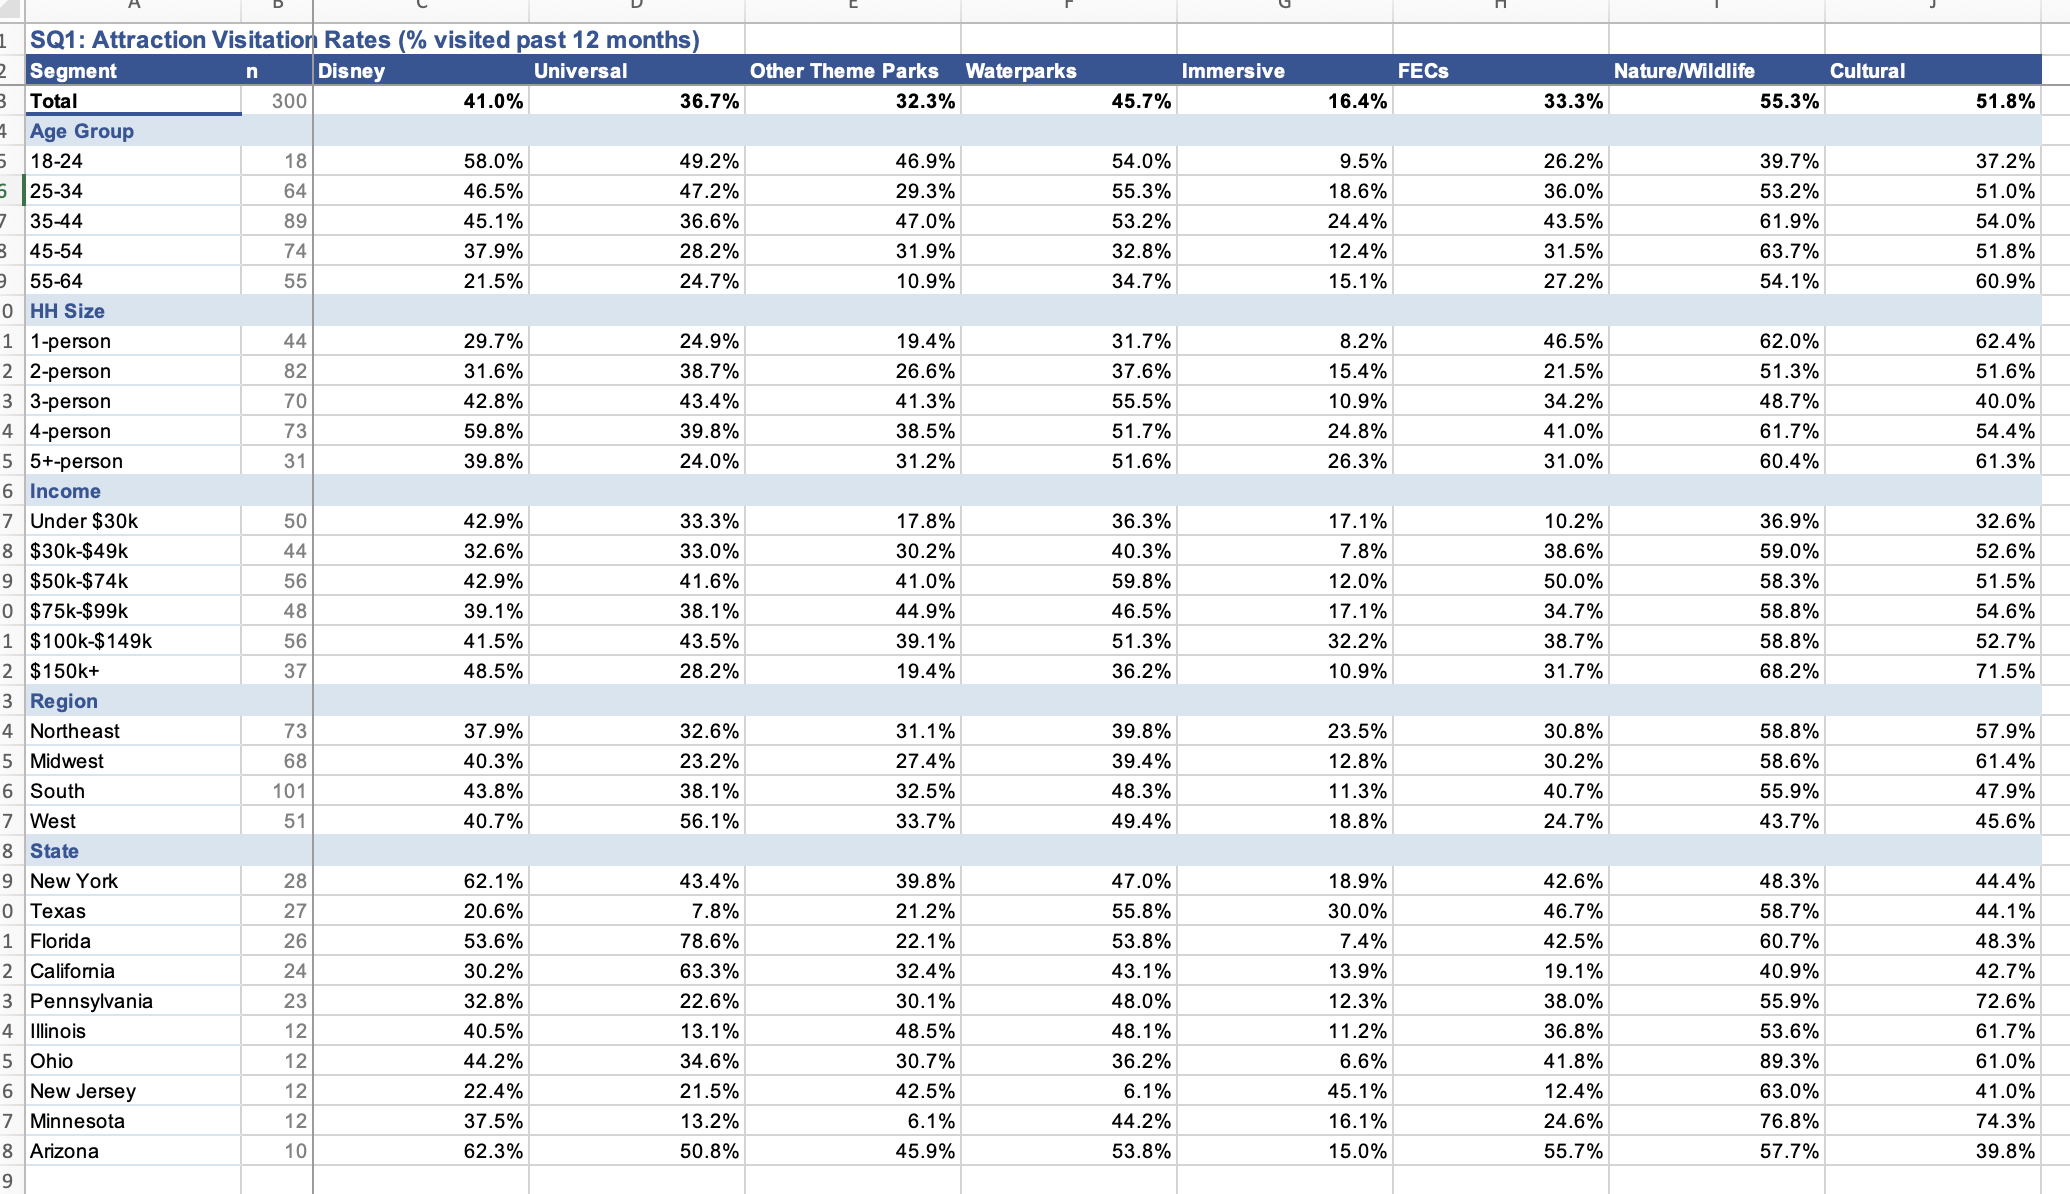
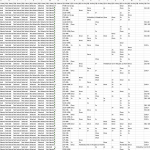
Visitation rates: Weighted visitation rates across Disney, Universal, other theme parks, waterparks, immersive/interactive experiences, FECs, nature/wildlife attractions, and cultural venues – broken out by age group, household size, income tier, U.S. region, and state.
Visit frequency: Distribution of visit frequency (once, 2x, 3+, visited but not in past 12 months) for each attraction category, segmented by demographics.
Spending: Total reported spending per attraction category across five brackets ($0–25 through $101+), segmented by income tier and household size.
Value-for-money perception: Full four-tier sentiment breakdown (excellent, good, poor, terrible) for each attraction category, segmented across all demographic dimensions.
Experience preferences: Visitor-selected favorite experience types (thrill rides, food & beverage, family/kids activities, nature/wildlife, immersive exhibits, and more), segmented by age, region, and household composition.
Pre-visit behaviors: How visitors plan before arriving – advance ticket purchases, website/app research, social media video consumption, VIP/skip-the-line reservations, and schedule coordination – segmented by age and income.
Decision factors: What influences visitors’ choice of attraction – ticket cost, travel distance, wait times, attraction type, travel party composition, seasonality, reviews, and loyalty – segmented by income and household size.
Dealbreaker complaints: The specific complaints that would prevent a visitor from returning – high costs, long waits, poor service, cleanliness, closures, safety, and navigation difficulty – segmented by age and income.
Open-ended favorites: Unstructured free-text responses from all 300 respondents naming their single favorite attraction experience in the past 24 months.
Demographics: Full demographic profile for each respondent including age, gender, household income, household size, education level, ethnicity, parental status, children’s ages, employment status, U.S. state, region, zip code, DMA, and languages spoken.
Operators, investors, consultants, developers, designers, and market research teams who need real-world demand-side benchmarks: how visitors actually decide, spend, evaluate, and complain across attraction categories – not just what operators report from the supply side.
Excel file (sortable, filterable, modeling-ready) with individual responses, pre-built Summary tab, and 24 chart sheets. Survey methodology included.
Disney theme parks, Universal Studios theme parks, other theme parks (Six Flags, SeaWorld, Dollywood, Herschend, etc.), waterparks, immersive/interactive experiences (Meow Wolf, immersive art, branded pop-ups), family entertainment centers (Topgolf, Dave & Buster’s, arcades, trampoline parks, VR), nature/wildlife attractions (zoos, aquariums, botanic gardens), and cultural attractions (museums, performances).
300 U.S.-based adults ages 18–64, screened to include only those who visited at least one attraction category in the past 24 months. Fielded online April 2026 across 40 states and all four Census regions. Responses post-stratified and weighted by the panel provider to normalize against demographic benchmarks. Margin of error ±5.7 percentage points at the 95% confidence level for aggregate results; wider for smaller subgroups.
Based on primary survey research conducted by The Park Database. The Park Database makes no representations or warranties of any kind, express or implied, with respect to these materials or the results of use thereof. Data reflects self-reported visitor responses and is subject to the limitations inherent in survey-based research, including recall bias and panel composition effects.