$495.00
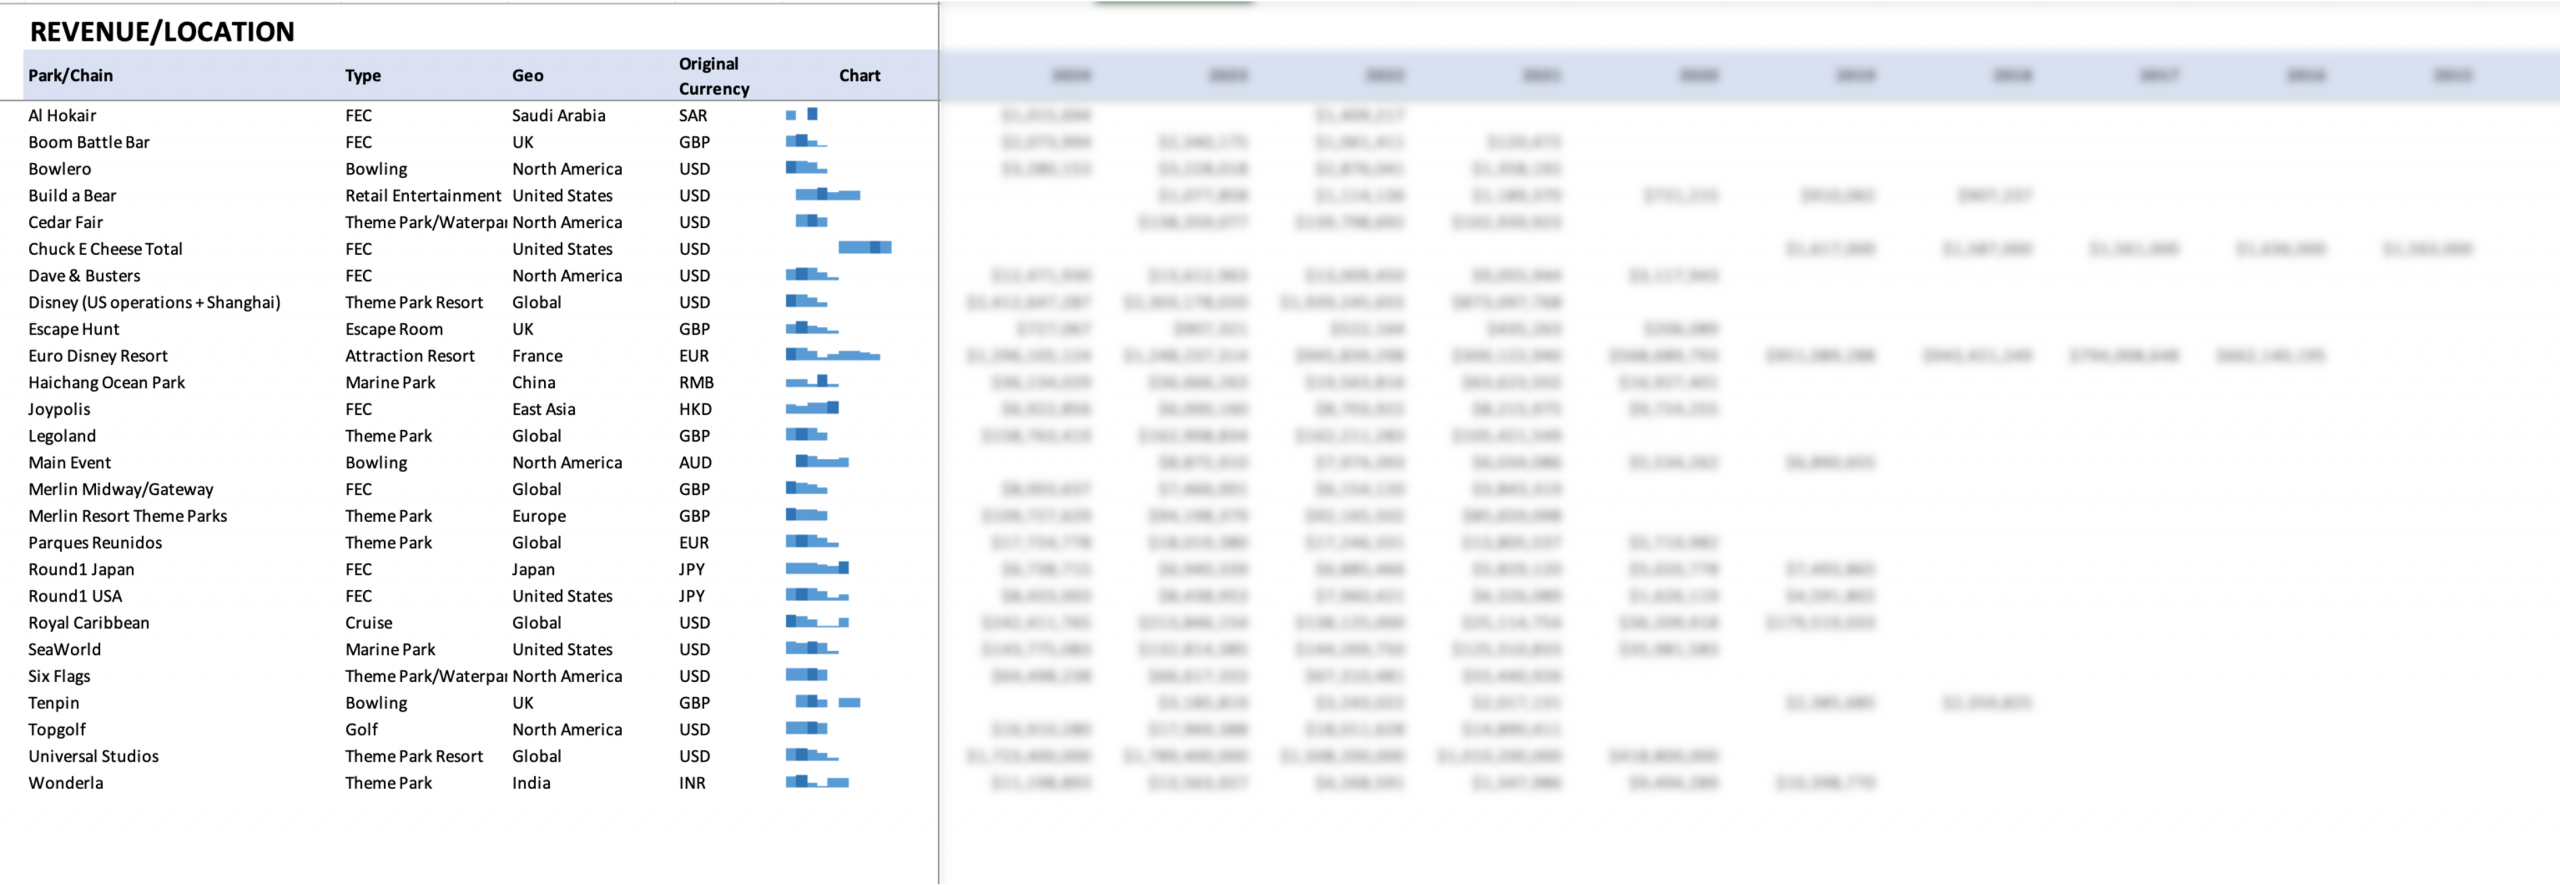
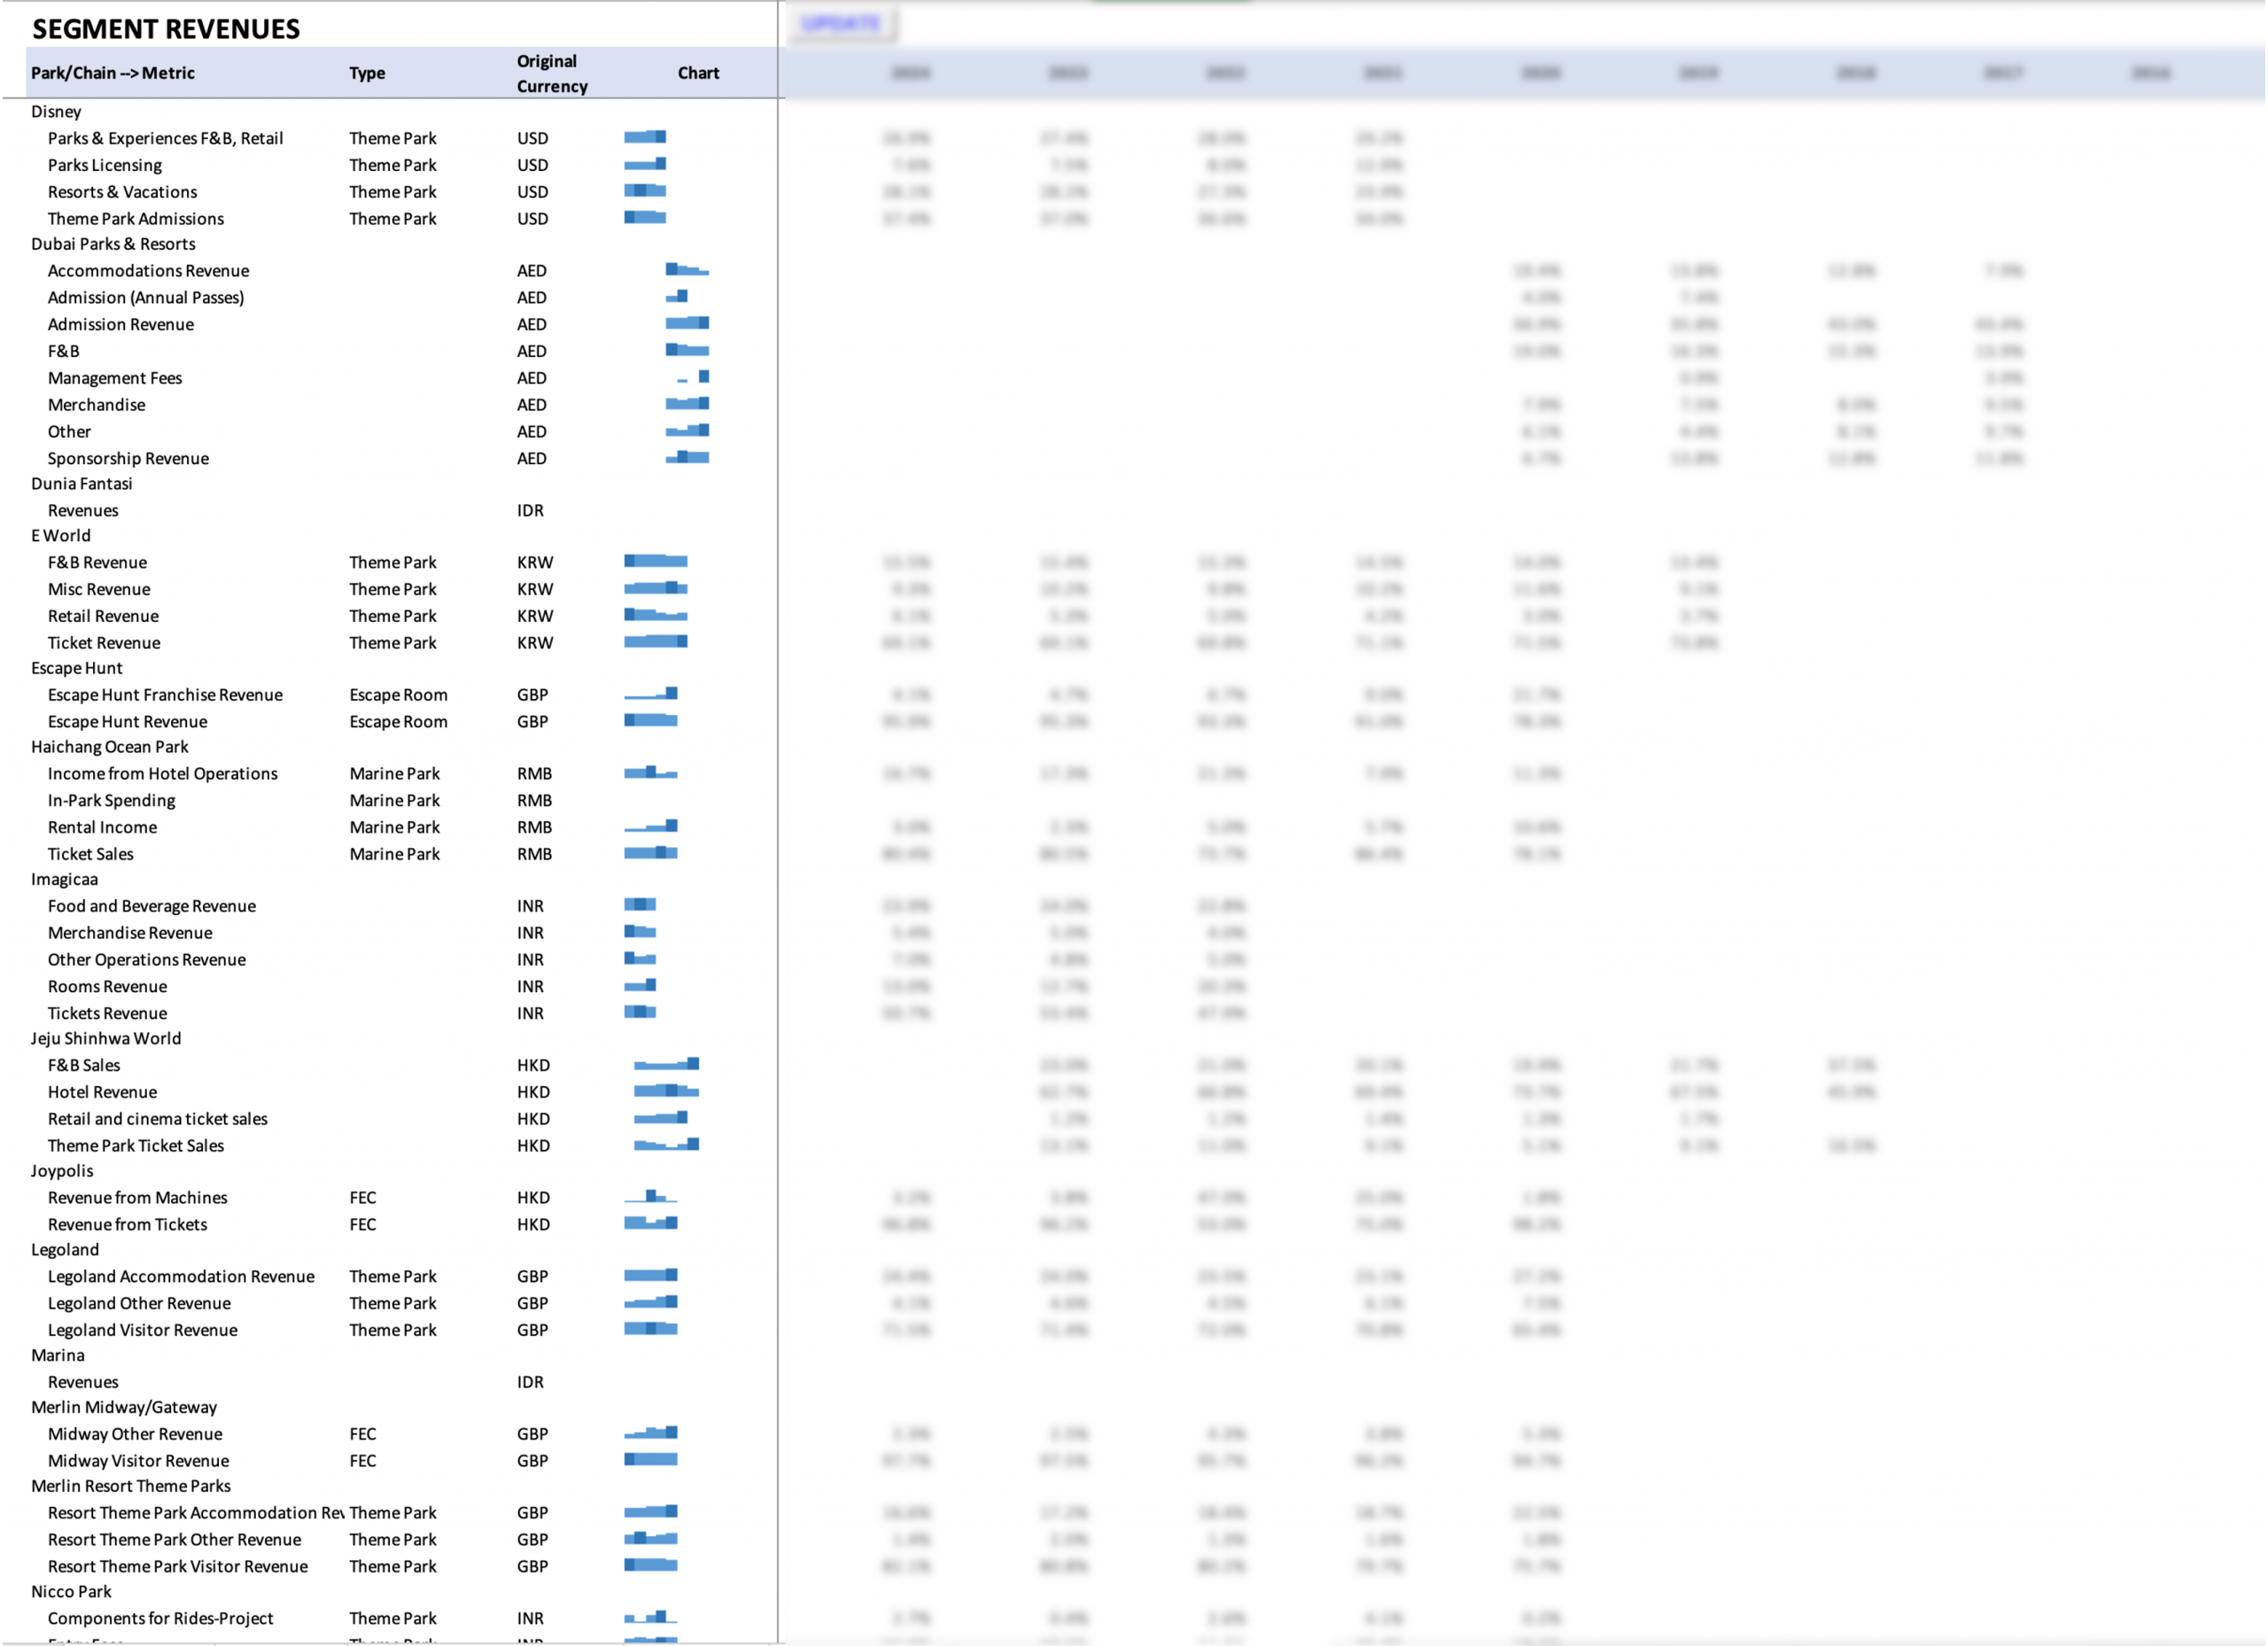
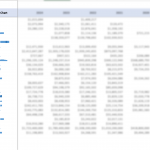
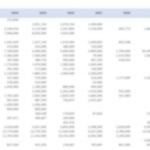
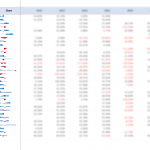
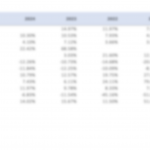
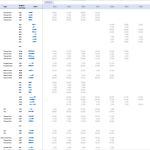
This dataset is a clean, analyst-friendly workbook that makes benchmarking, sanity checks, and feasibility planning quick and defensible.
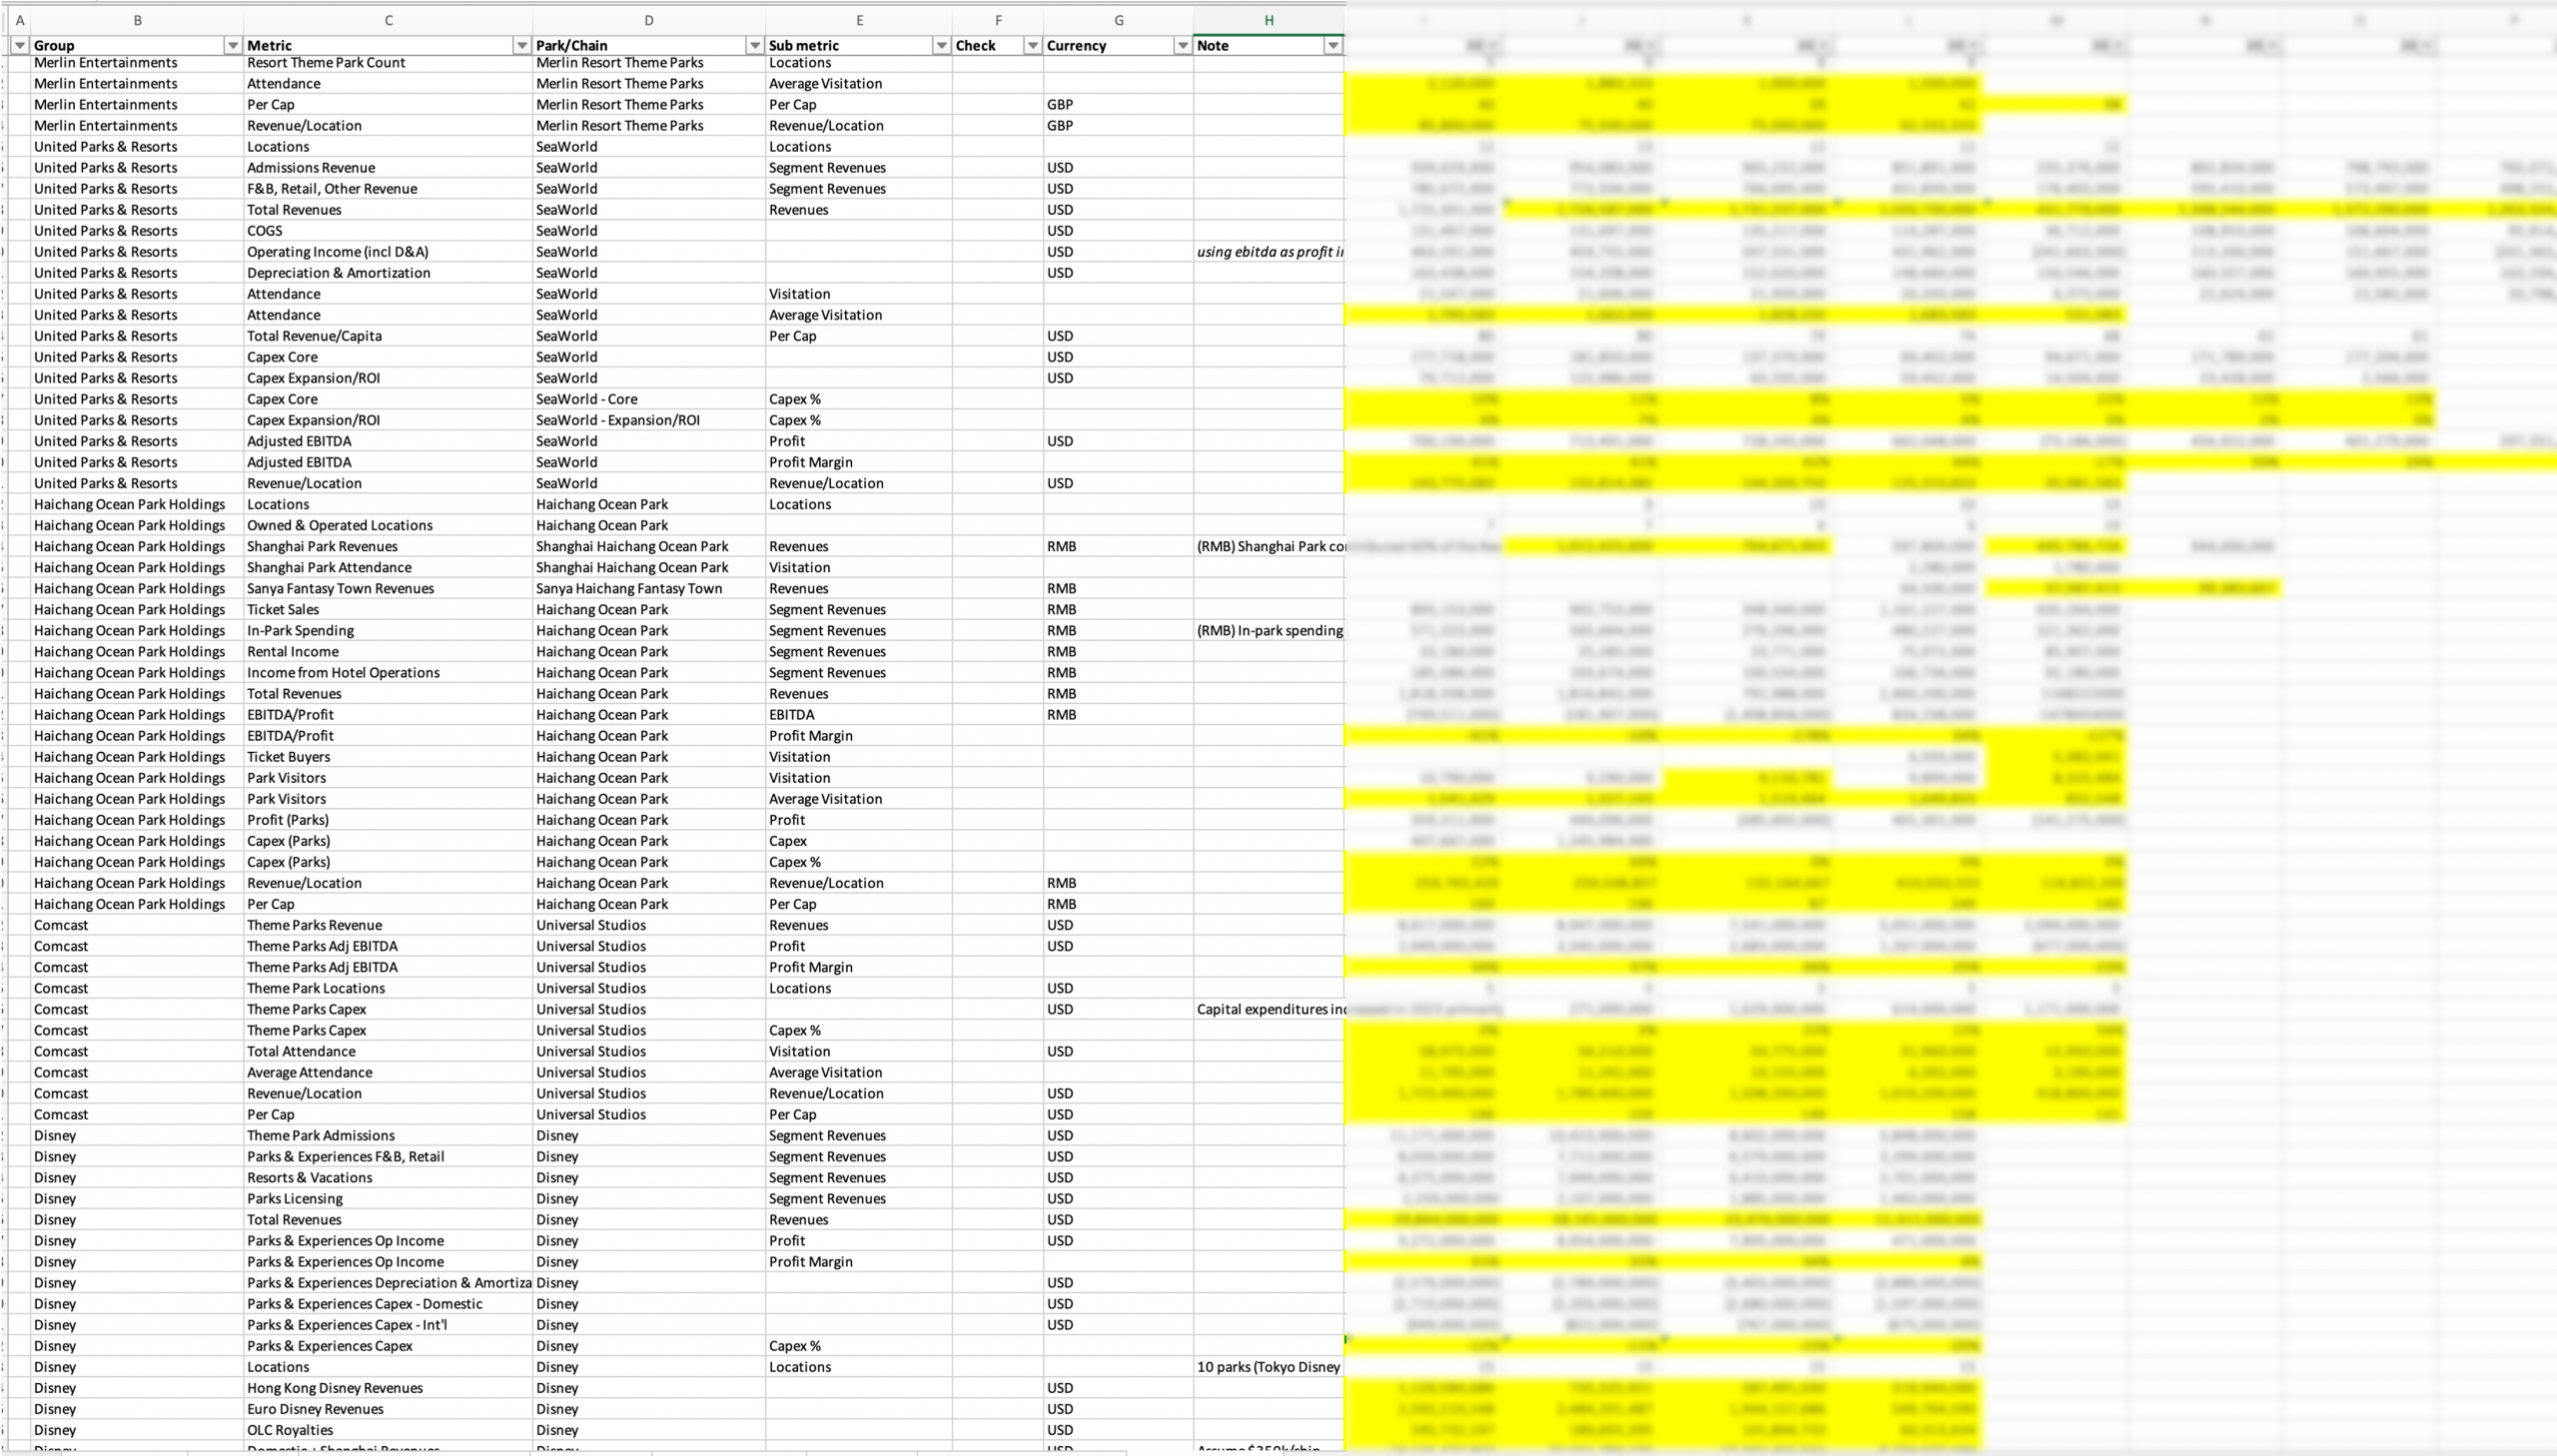
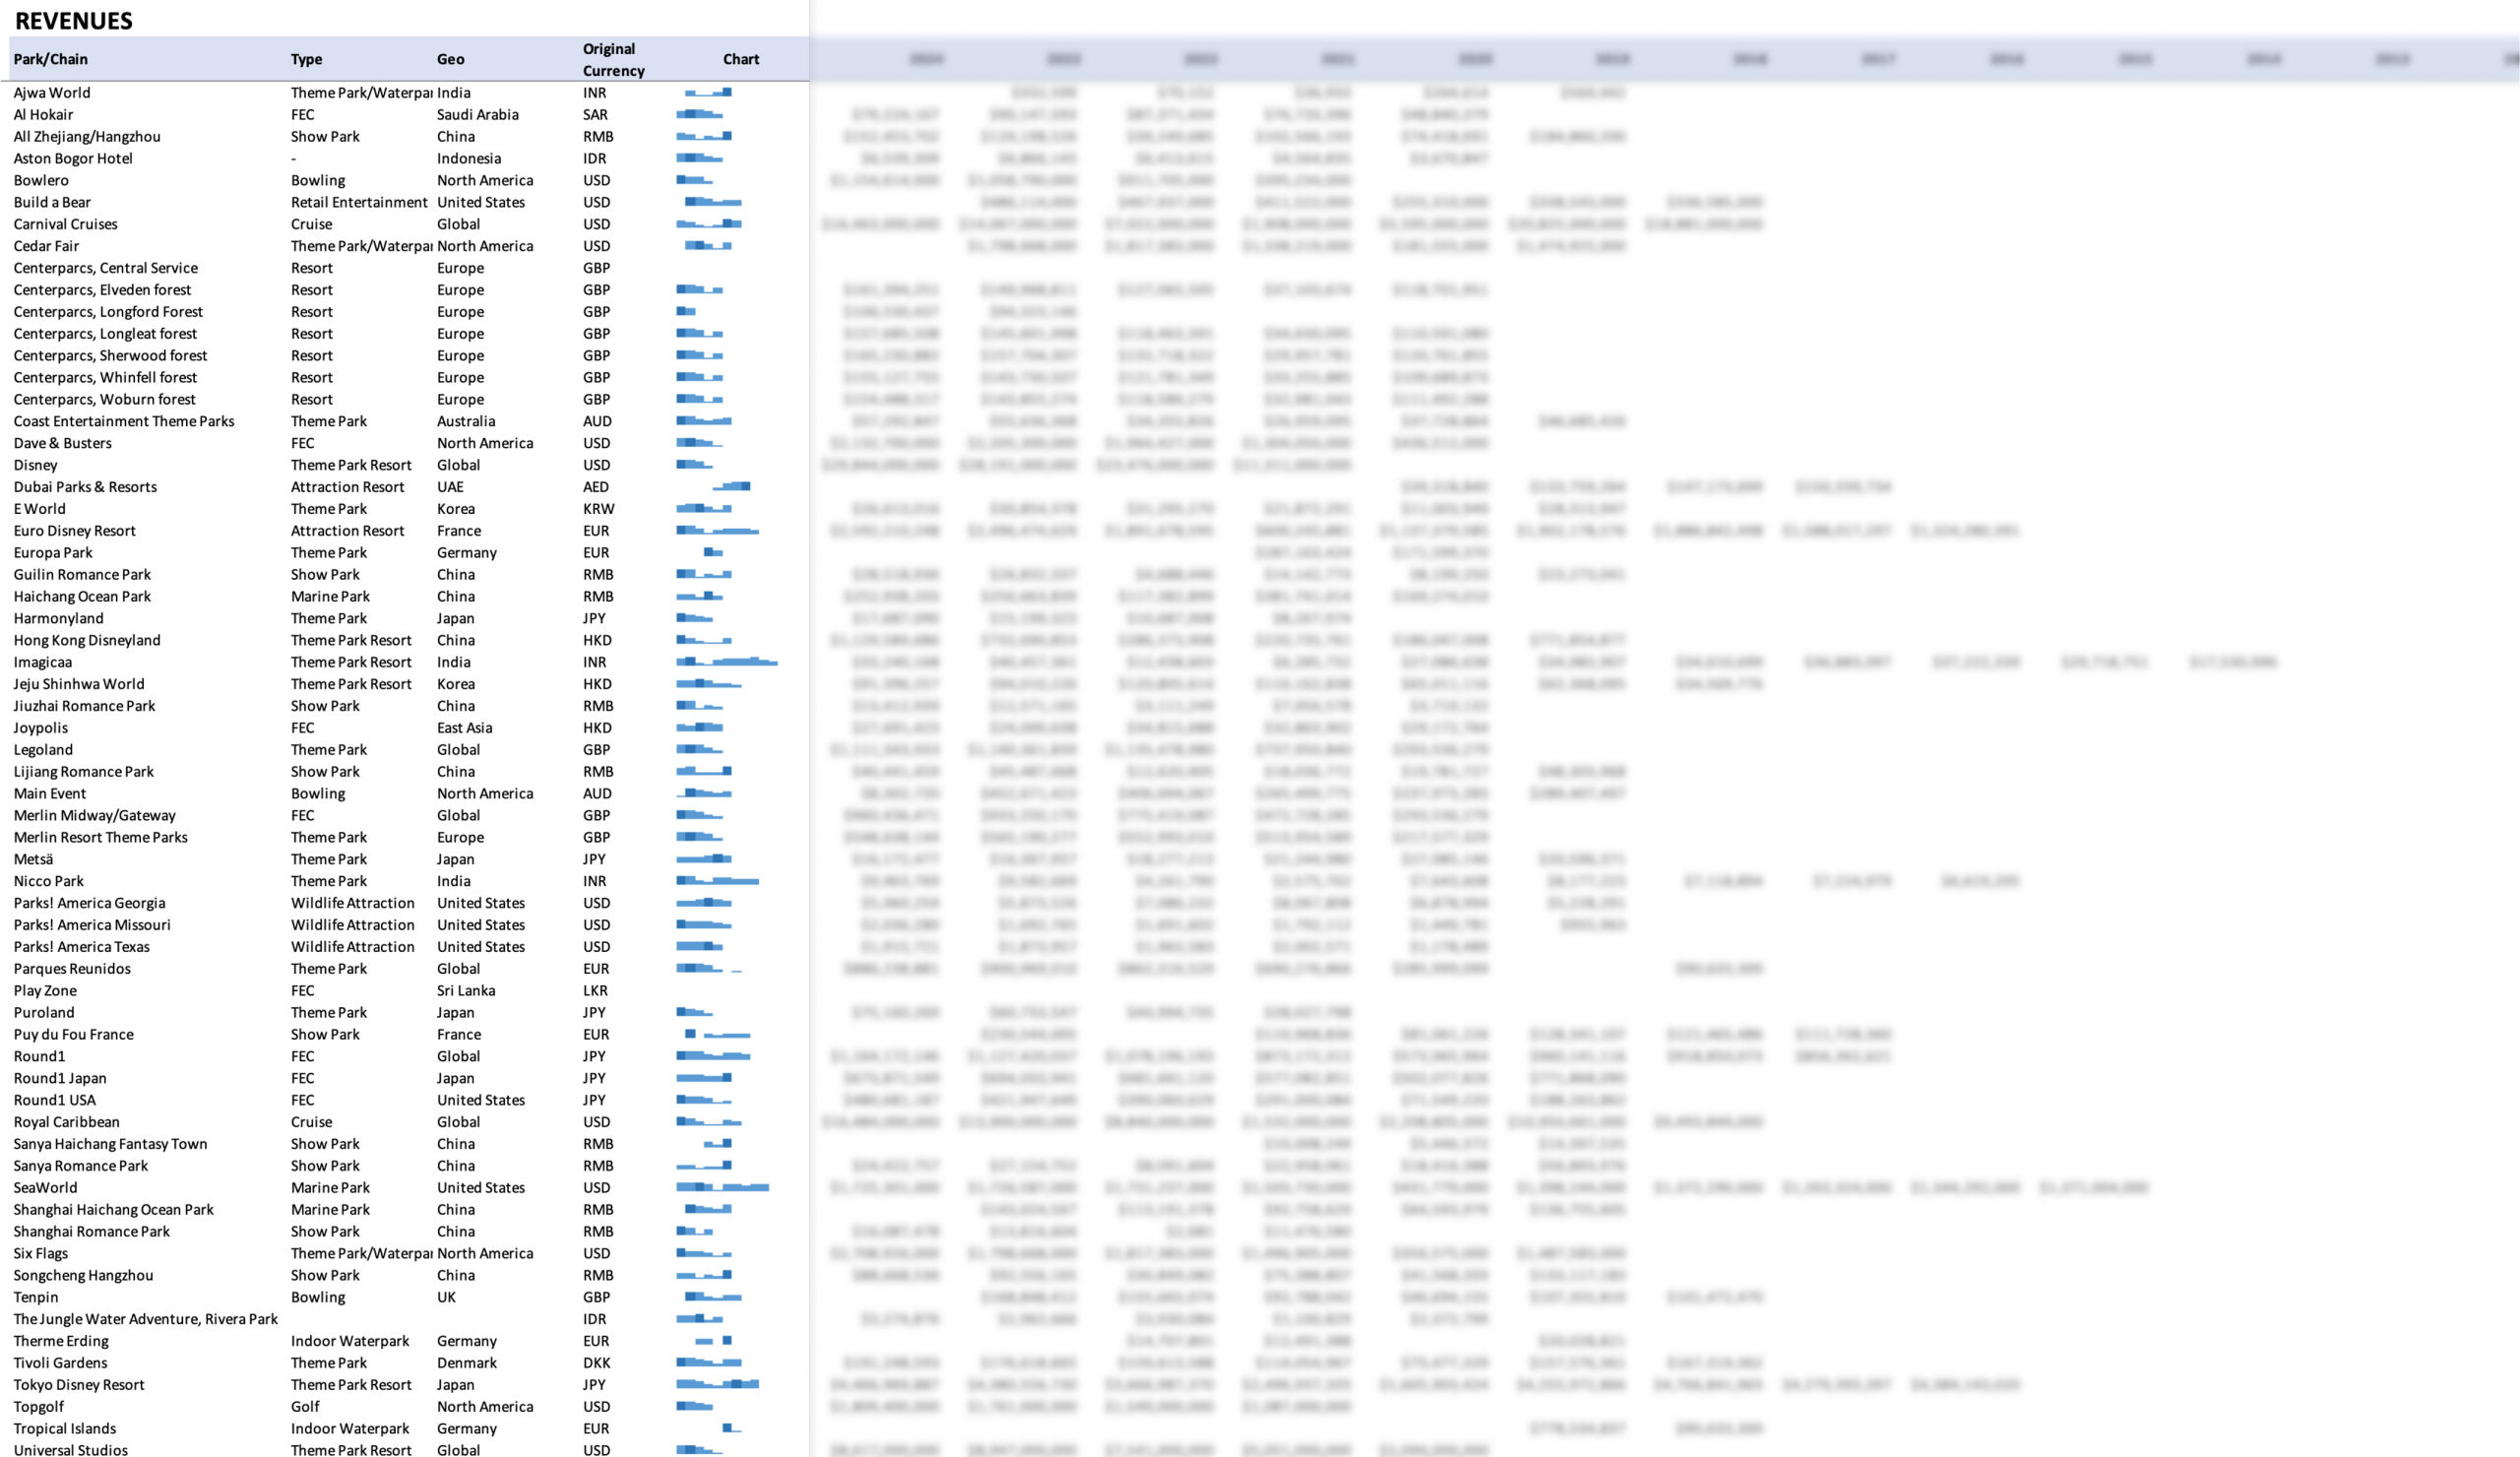
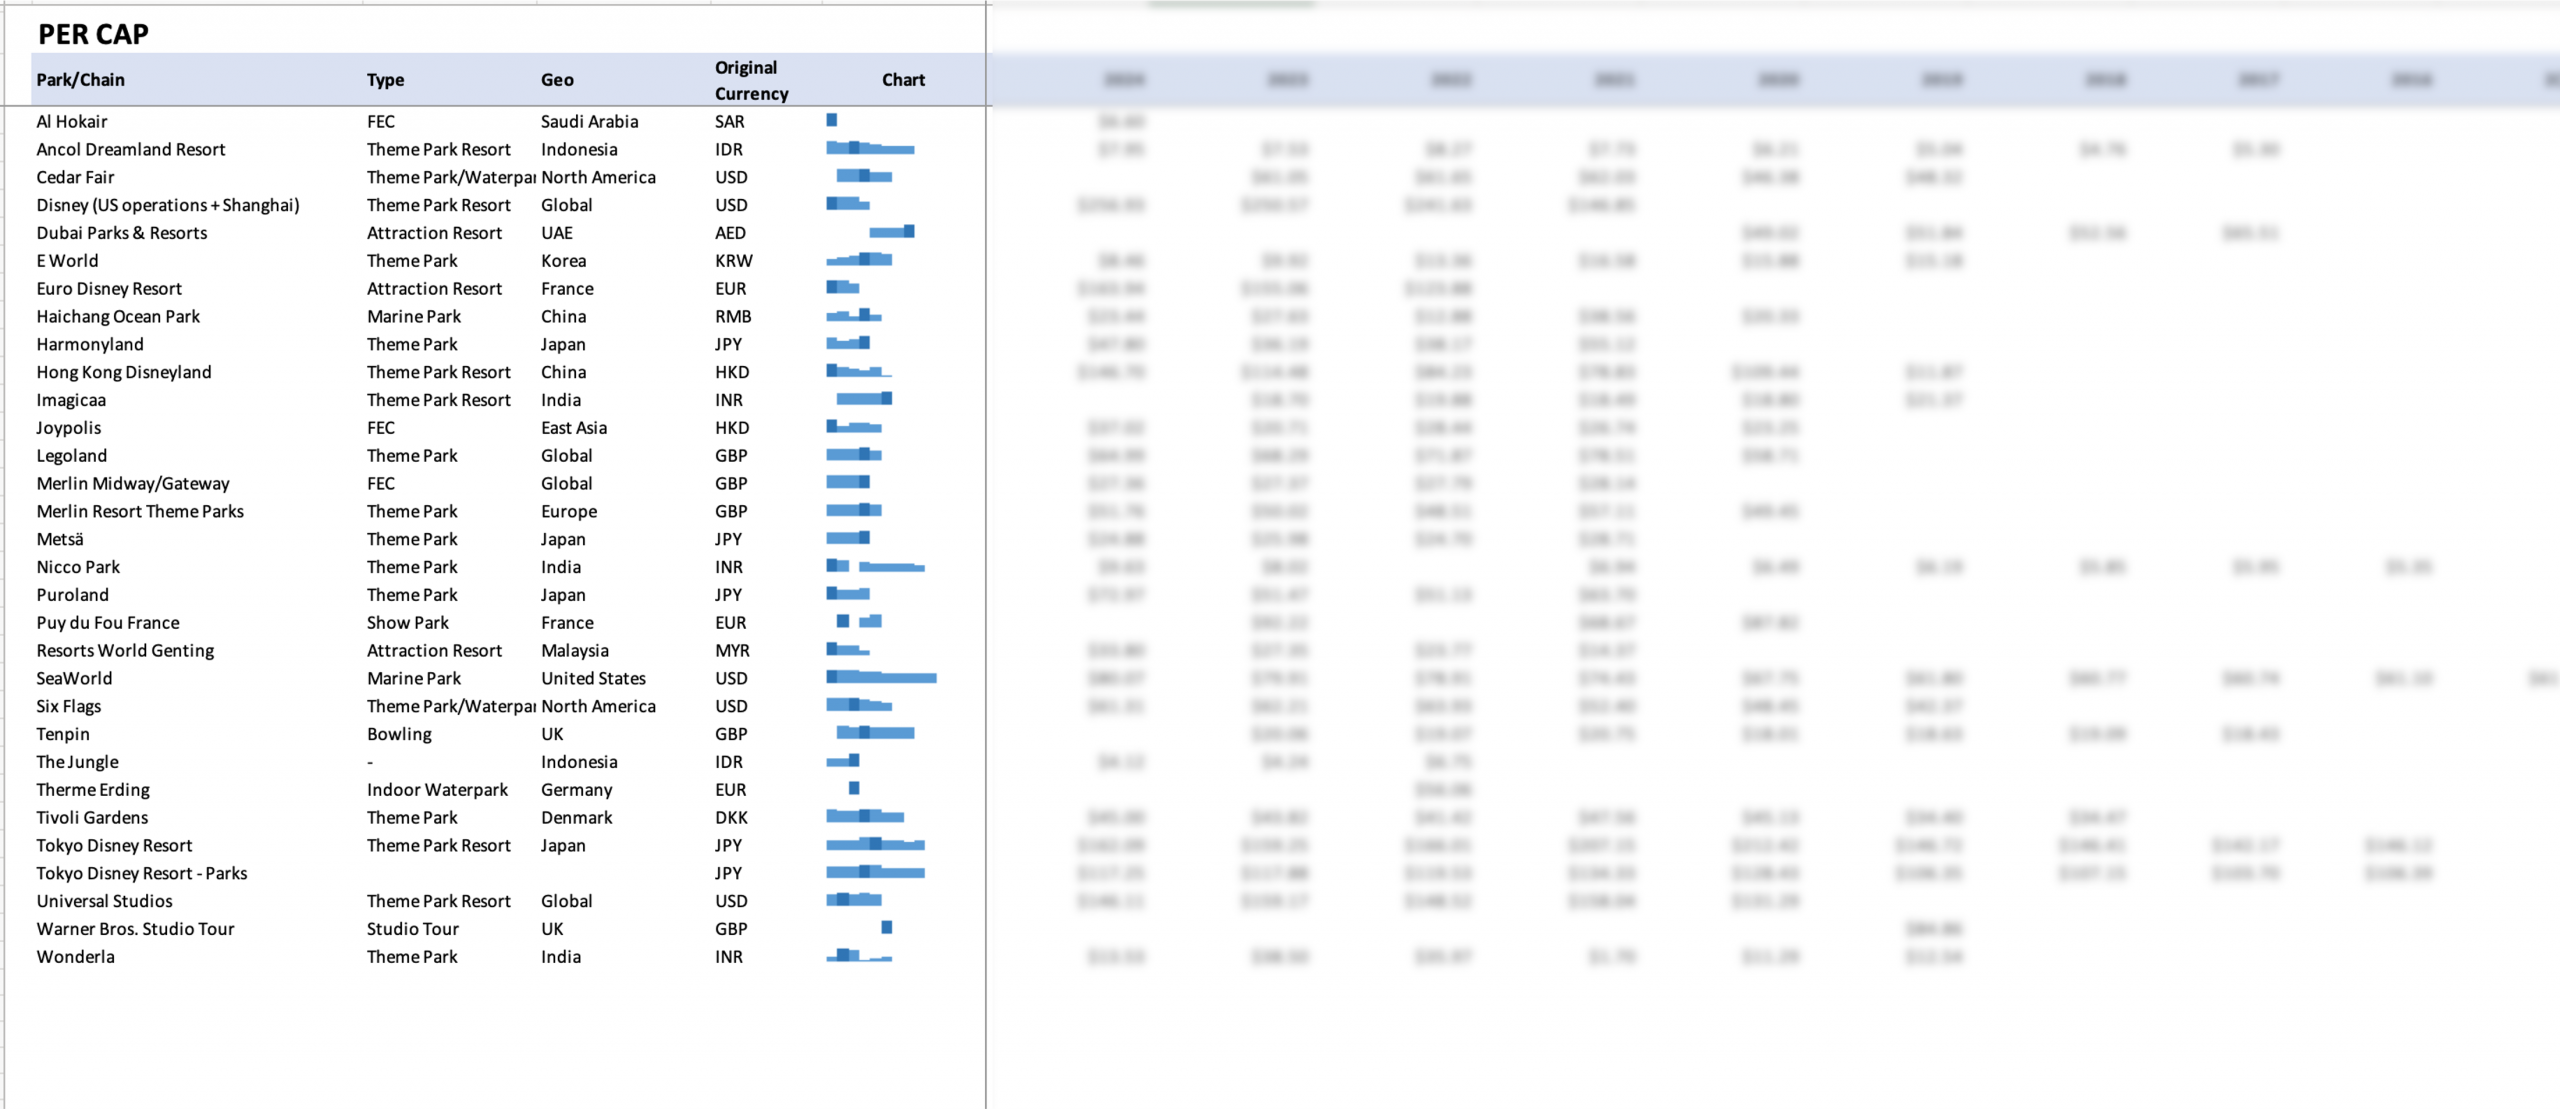
The product includes a fully-open Excel master sheet (click here for data availability) and seven purpose-built views of operator performance.
The data is structured and consistent, and easy to upload into Power BI, Tableau, Python/R, AI tools, or your own financial model, and also well-suited for internal knowledge bases.
Disney
Universal Studios
Tenpin
Warner Bros. Studio Tour London
Dave & Busters
Joypolis
Sanrio
Coast Entertainment (Dreamworld, Whitewater World)
Bowlero
Al Hokair
Escape Hunt
Boom Battle Bar
XP Factory
Topgolf
Merlin
Legoland
SeaWorld
Haichang Ocean Park
Universal Studios
Disney
Tivoli Gardens
Six Flags
Cedar Fair
E World (Korea)
Nicco Park
Ajwa World
Resorts World Genting
Parks! America
Imagicaa
Songcheng Hangzhou
Tokyo Disney Resort
Wonderla
Round1
Hong Kong Disneyland
Centerparcs
Parques Reunidos
Build a Bear
Sunway Lagoon
Euro Disney Resort
Puy du Fou France
Europa Park
Tropical Islands
Therme Erding
For most of the names listed here, the financials begin in 2019, and continue to the latest available reporting year unless the business was privatized, merged, or the information was otherwise made unavailable. Data is updated twice yearly. As of the time of publication, all figures have been updated through 2024 as 2025 figures are not yet available.
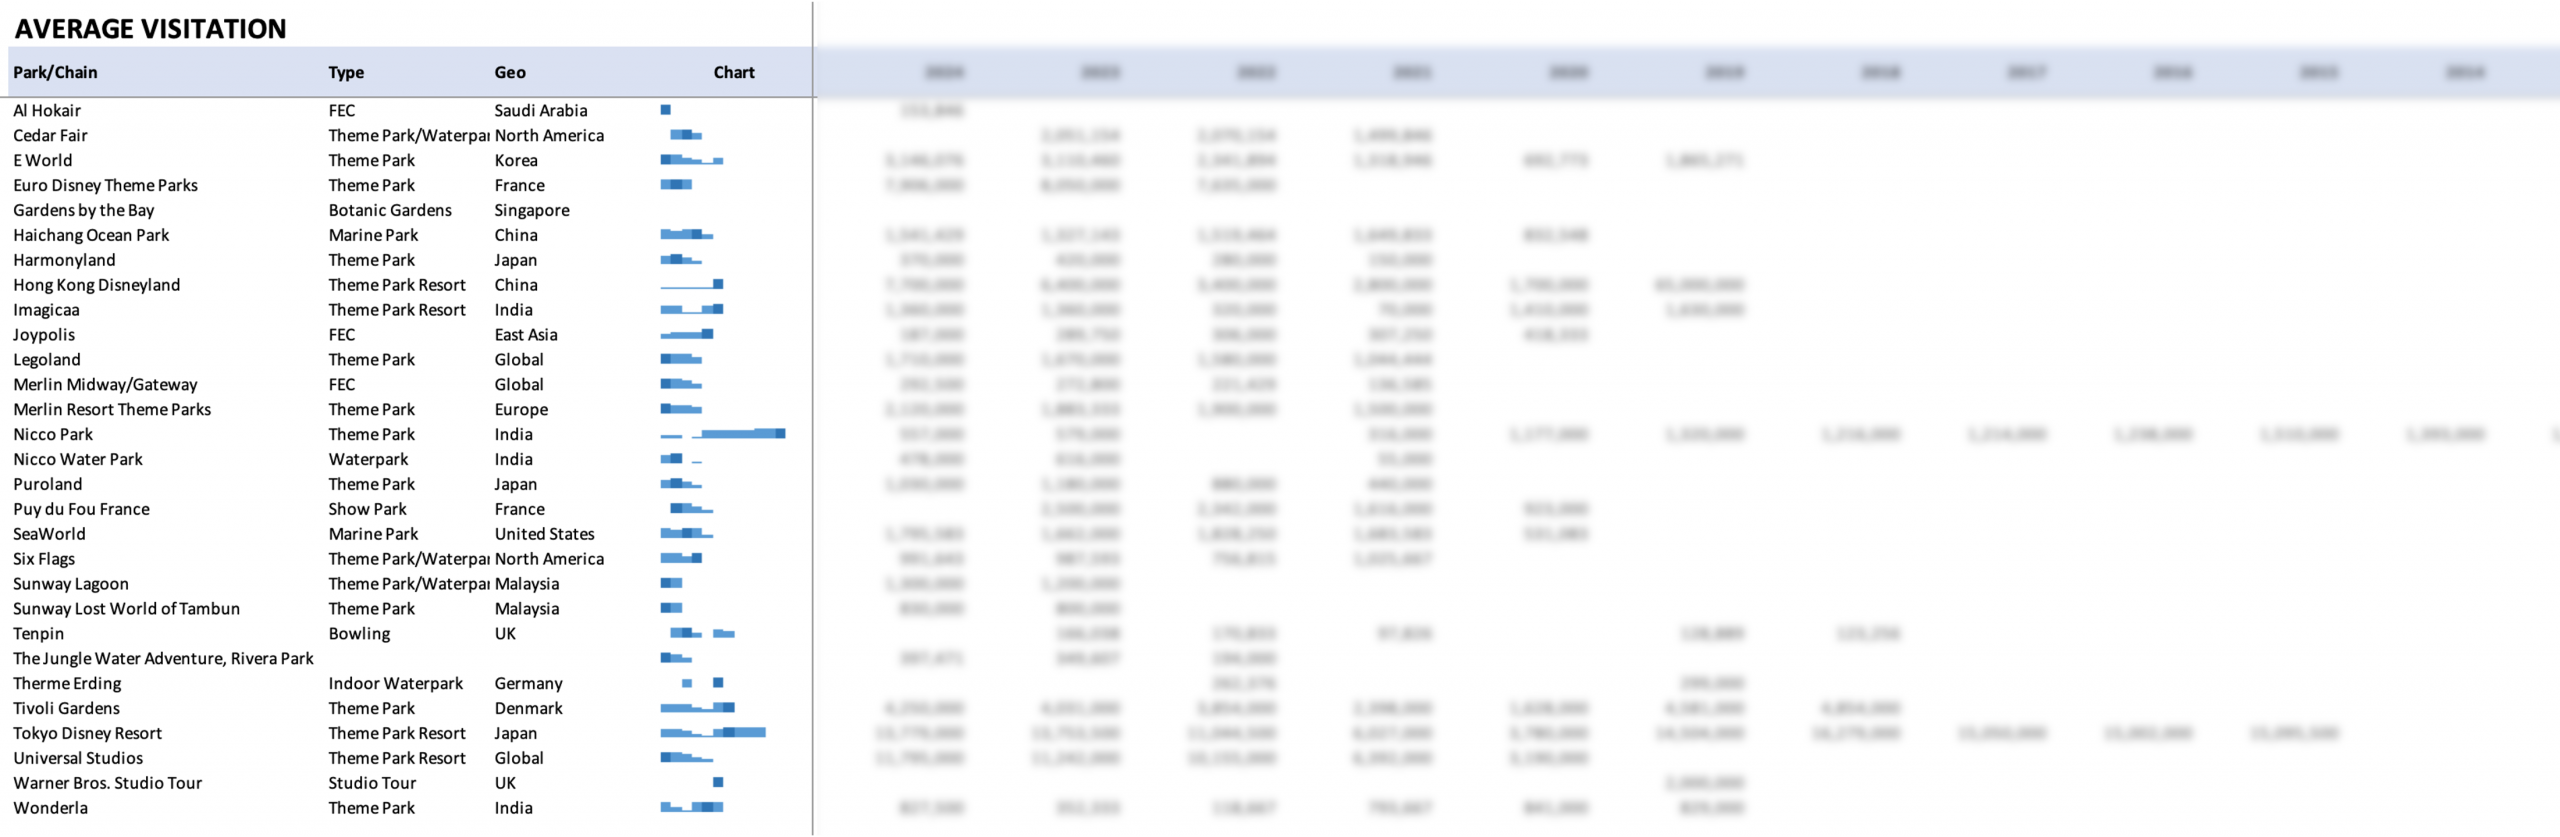
Attendance Disclaimer
Please check dataset availability to see if this product fits your research needs. Attendance is limited to what is reported by the operators – sometimes at the group level, sometimes at the segment level.
For more detailed, historical attendance at the park level, consider our data download product. While we don’t like the idea of splitting this into two products either, the misalignment is too great. Financial data is often presented in aggregated or regional form, especially for brands who operate more than a handful of parks, and is not broadly available on a detailed park-by-park basis.
Based on disclosed information aggregated from a variety of sources, including government releases, securities filings, published annual reports, and fact books. The Park Database makes no representations or warranties of any kind, express, or implied, with respect to these materials or the results of use thereof. Data has been aggregated from sources deemed reliable at the date of publication, but accuracy and completeness is not guaranteed.