Table of Contents
We surveyed a cross-section of U.S. attraction visitors. Here’s what they told us.
New TPDB research reveals how Americans choose, spend at, and evaluate attractions – across eight categories from Disney to zoos.
The attractions industry talks a lot about attendance, but the people who drive that revenue – the visitors – remain understudied. What’s missing is the demand side of the equation: how do visitors decide where to go, what do they value once they get there, and what would stop them from coming back?
This report fills that gap. The Park Database (TPDB) surveyed 300 U.S. attraction visitors across 40 states, spanning ages 18 to 64 and all household income levels. Respondents were screened to include only those who have visited at least one attraction category within the past 12 months, ensuring that every data point reflects recent experience rather than hypothetical intent. Results were segmented by income levels, age, household composition, and region.
Here’s what stood out to us. Scroll to the end of this article to find the full methodology, as well as chart book and Excel downloads.
Why Exactly Disney is Unique
People grumble, but go anyway
Disney has the lowest value-for-money rating of any category in this survey: in the aggregate, just 63% of respondents rate it as excellent or good value, with 14% calling it “terrible value” – a label no other category receives at anywhere near that rate. Universal performs better at 74%, and nature/wildlife and cultural attractions sit at the top, with levels above 90%.
Yet demand for Disney is remarkably inelastic, with its visitation rate flat across income tiers, ranging from 33% to 49% regardless of household earnings. It’s not a luxury product by access – people at every income level find a way to go. In fact, households earning less than $30k report a visitation rate to Disney above other categories such as FECs, zoos, aquariums, and museums, and once at the park, spend at a rate that matches those of higher earners.
Disney is selling a feeling
Despite the value complaints, when we asked visitors to name their single favorite experience from the past 24 months, Disney was the second most-cited category overall, with 48 mentions. These open-ended responses reinforced the lack of value perception; respondents regularly volunteered cost complaints inside a question that asked about their favorite experience – “I love Disneyland even though it is expensive,” “Disneyland is my favorite but so expensive now.”
And yet the responses revealed something deeper as well, especially when compared alongside Universal Studios, the rival megapark brand. Responses for Disney were filled with emotional terms, the language about magic, childhood, family, and identity: “It is so magically and so much to do,” “It’s like visually seeing my childhood comes to life in real time,” “Being there with my grandkids and watching their joy,” “It made us feel special.”
Open-ended responses that named Universal Studios did evoke some feelings – “my kids really enjoy this brand,”, “always have fun when I go,” “the characters there made us laugh at lot,” but many were more likely to name specific rides. “Hagrid’s motorbike ride,” “The Simpsons ride,” “Harry potter experience,” “I got to see Mario land,”, “it has rides and a movie theater.” Many people are naming individual products, as if the park is the container and the ride is the memory.
The industry often speaks of Disney and Universal Studios as a megapark monolith, but the results show that their difference may be deeper than just character branding.
The biggest behavioral differences are generational, not economic
How visitors rate value
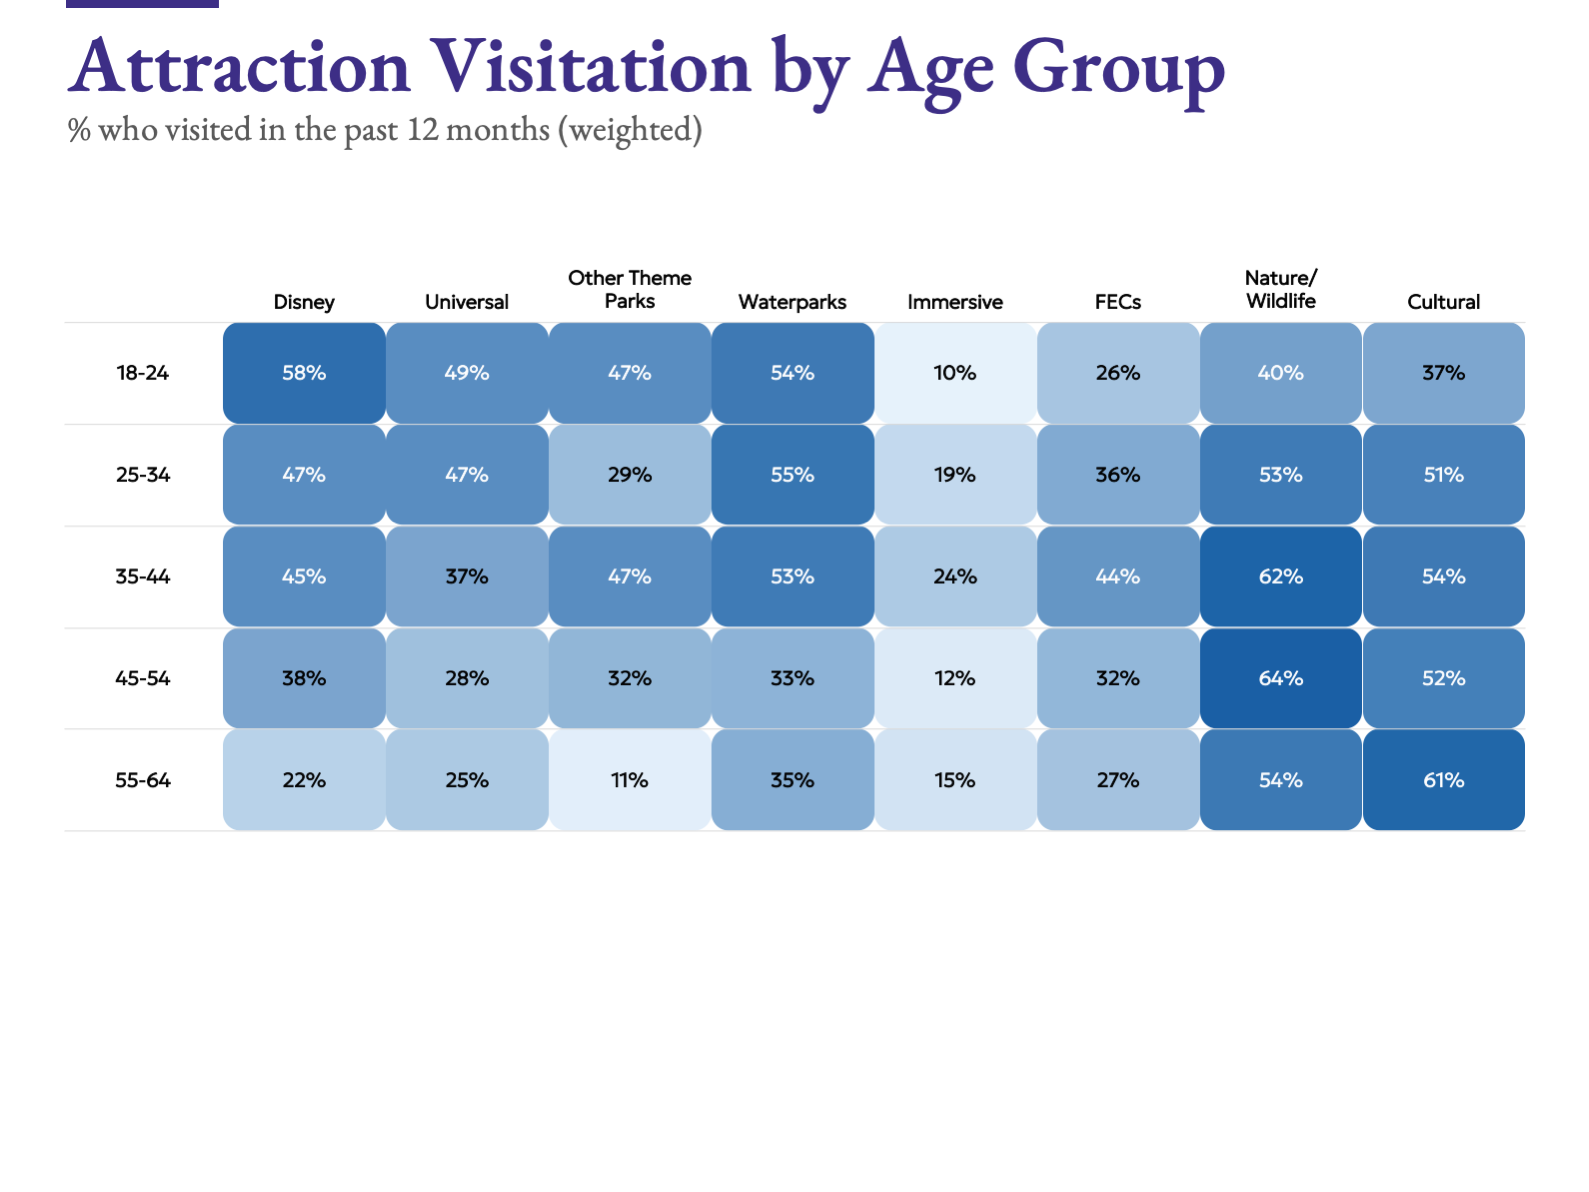
While we’ve seen that Disney’s value perception is the poorest on average among all the categories, this perception varies significantly by age and generation. A majority of Gen Z (aged 18-24 in the survey) rate the park as a good/excellent value, while a minority of older Gen X’ers (aged 55-64) in the survey do so. In general, younger respondents had more favorable views about attraction value for money overall, compared to older respondents.
What visitors want from an experience
Among 18-24-year-olds who had visited at least one attraction during the past year, they are most likely to have visited Disney (58%) and waterparks (54%). For the oldest cohort, cultural attractions lead at 61% and nature/wildlife at 54%, while Disney drops to 22%. FECs hold relatively steady in the 27-44% range across age groups, making them one of the more age-resilient categories.
Immersive experiences remain niche, peaking at 24% for 35-44s and dropping outside that band. The generational shift in experience preferences is also dramatic. Perhaps expectedly, for those aged 18-24, thrill rides dominate at 66%. By 55-64, thrills collapse to 24% and are replaced by food & beverage (47%) and more passive “thrills”, such as nature/wildlife and cultural exhibits. Those in middle age tend to have a more balanced profile overall.
How visitors plan
Pre-visit behaviors also show a clear generational pattern. Video research (e.g. YouTube, TikTok) drops from ~60% among 18–34-year-olds to less than 30% for 55–64s. Advance ticket purchasing runs in the opposite direction, peaking at 74% for 45–54s. VIP/skip-the-line reservations peak at 26% for 35–44s – the age most likely to be balancing young children with limited time – then drops to just 11% for the older cohort.
Re: VIP passes, we had expected to see higher earners booking more VIP access, but it didn’t show in the data – the highest income group ($150k+) actually had the lowest rate of pre-booking such ancillaries, suggesting perhaps a greater rate of spontaneous purchases at the gate.
Dealbreakers for visitors
High costs are the top dealbreaker across nearly every segment, but the second-tier concern depends on age. Among 18-24s, the runner-ups are closures (45%) and safety (38%). Among 25-34s, cleanliness surges to 54%. By 55-64, long wait times hit 75% – nearly triple the 28% cited by the youngest cohort.
Cost is the universal concern – and visitors say so unprompted
Across every demographic cut, cost-related factors dominate. Ticket cost is the #1 decision factor at 71% overall, the #1 dealbreaker at 71%, and the most consistent theme across age, income, household size, and region. This is not a low-income phenomenon, either: $150k+ households cite high costs as their top dealbreaker, the highest of any income tier.
The open-ended responses reinforce this. Of the 300 free-text answers about favorite experiences, 16 mentioned price or value without being asked – and the split is revealing. Respondents who named zoos, state parks, or Dollywood framed value positively: “a good deal,” “affordable,” “free or minimal cost.” Respondents who named Disney or Universal framed it as a concession: “even though it is expensive,” “too pricey,” “the price has really jumped.”
One respondent put it plainly: “I like the zoo, and it’s not as expensive as the other things I’ve been priced out of.” This captures a dynamic worth watching: lower-cost categories may be gaining share not because they’re getting better, but because premium categories are pricing visitors out.
Solo visitors anchor on price
Ticket cost is the dominant decision factor for solo households at 84% – the highest single-factor score in the entire dataset, at a level far exceeding concerns about wait times (~50%) or even the type/theme of attraction being considered.
Categories that deserve more attention
Nature and cultural attractions: consistently excellent
Nature/wildlife and cultural attractions lead the survey on almost every positive metric. They’re the most-visited categories overall (55% and 52%). They have the highest value-for-money ratings (92% and 94% positive). They generate strong repeat visits (22% and 29% at 3+ annually). And their value perception barely wavers across age, income, or region.
The open-ended responses add texture. Zoos and aquariums were the single most-mentioned category with 51 responses, and the language is specific, and habitual: “The Toledo Zoo always has a ton of new baby animals. We’ve been countless times.” Museums and cultural venues drew 34 mentions emphasizing learning and sensory engagement: “The Smithsonian museums in D.C. were amazing and some of the coolest places I’d ever seen.” These categories don’t generate the anguished love-hate relationship that Disney does, visitors simply enjoy them and come back.
FECs: lifestyle & convenience
FECs are a bit of a paradox. They have the highest repeat-visit rate in the survey (35% going 3+ times annually), the strongest middle-income following ($50k–$74k households visit at 50%), and one of the most age-resilient profiles. Solo and 5+-person households both reach 50% at 3+ visits. By every behavioral metric, FECs are sticky.
But in the open-ended responses, FECs generated just 7 mentions out of 300 – and not a single one used emotional, nostalgic, or sensory language. The strongest sentiment was functional: “being able to play unlimited games and access to food and drinks.” Another respondent captured the category’s convenience appeal: “I can go on a quick without planning a whole lot and go and have fun.”
Waterparks: the all-day family equalizer
Waterparks are the third most-visited category overall at 46%, and they index highest among 25-44-year-olds (53-55%), those in the prime family-formation years. In the open-ended responses, waterparks drew 24 mentions, and the dominant theme is family togetherness (29% of responses mention family) and all-day time value (12%): “The water park was the most fun because we were there all day, so it was worth the price.” Four-person households drive the highest waterpark repeat rate at 20% going 3+ times. Waterparks don’t generate the cultural cachet of museums or the emotional attachment of Disney, but they deliver a reliable, democratically enjoyed family day out.
Immersive experiences: promising but still niche
Immersive/interactive experiences (Meow Wolf, immersive art, branded pop-ups) are the least-visited category at 16% overall, peaking at 24% among 35-44s and dropping to under 15% for most other age groups. Yet they score the third-highest value-for-money rating at 83% positive, and among the few open-ended respondents who mentioned them, the language is distinctly sensory: “visually stunning,” “pretty cool – I hadn’t been to a location like that before.”
The category’s emotional signature is different from everything else. Where Disney generates attachment and nostalgia and FECs evoke convenience, immersive experiences generate aesthetic wonder.
Download the report
Download the full U.S. 2026 VIBE report.
Purchase the raw data here to plug into your own analyses.
Survey Methodology
Overview
The TPDB VIBE Survey was conducted in April 2026 to understand how American consumers choose, experience, and evaluate leisure attractions across eight categories. The survey was designed and analyzed by The Park Database (TPDB).
Sample
A total of 300 U.S.-based adults completed the survey. All respondents were ages 18–64, resided across 40 U.S. states and all four Census regions (South: 101, Northeast: 73, Midwest: 68, West: 51), and were screened to include only those who had visited at least one of eight attraction categories within the past 24 months. Respondents who selected “None of the above” for all attraction categories were excluded. The sample included 166 males and 134 females, with a mean age of 42.
The survey was fielded online on April 9, 2026, via Pollfish. All respondents were located in the United States and verified against the panel provider’s quality controls.
Screening Criteria
Respondents were screened using a multi-select question (SQ1) asking whether they had visited any of the following attraction types in the past 12 months: Disney theme parks, Universal Studios theme parks, other theme parks (Six Flags, SeaWorld, Dollywood, Herschend, etc.), waterparks, immersive/interactive experiences (immersive art, Meow Wolf, branded pop-ups), family entertainment centers (Topgolf, Dave & Buster’s, arcades, trampoline parks, VR), nature/wildlife attractions (zoos, aquariums, botanic gardens), or cultural attractions (museums, performances). Only respondents who selected at least one category proceeded to the full survey. On average, respondents had visited 3.2 of the eight categories.
Questionnaire Design
The survey covered the full visitor journey across ten question areas:
- SQ1: Attraction categories visited in the past 12 months (multi-select screening question)
- Q1: Household size
- Q2: Annual household income
- Q3: Visit frequency by attraction type (once, 2x, 3+, or visited but not in the past 12 months)
- Q4: Total spending by attraction type (five brackets from $0-25 to $101+)
- Q5: Value-for-money perception by attraction type (excellent, good, poor, terrible, or don’t know)
- Q6: Overall favorite experience in the past 24 months (open-ended)
- Q7: Favorite experience types in the context of an attraction (select up to 3 from 11 options)
- Q8: Pre-visit planning behaviors (multi-select from 7 options)
- Q9: Decision factors influencing attraction choice (multi-select from 10 options)
- Q10: Dealbreaker complaints that would prevent a return visit (multi-select from 7 options)
Questions Q3, Q4, and Q5 were asked for each attraction category the respondent had visited or was familiar with, enabling cross-category comparison on a like-for-like basis. Full questions are available in the chart book.
Weighting
Responses were weighted to adjust for demographic representation. Weights ranged from 0.57 to 3.23, with a mean weight of 1.0. All results reported in this study are weighted unless otherwise stated. Unweighted sample sizes (n) are provided alongside each segmented result to indicate the base for each subgroup.
Segmentation
Results were analyzed across five demographic dimensions: age group (18-24, 25-34, 35-44, 45-54, 55-64), household size (1-person through 5+), household income tier (Under $30k through $150k+), U.S. Census region (Northeast, Midwest, South, West), and U.S. state (top 10 states by respondent count).
Limitations
As with any survey research, several limitations should be noted. At a 95% confidence level, a sample of 300 yields a margin of error of approximately ±5.7 percentage points on any reported proportion, assuming a 50% baseline (the most conservative estimate). For subgroups with smaller sample sizes – such as the 18-24 age band (n=18), where the margin of error widens to approximately ±23 points – results should be interpreted as directional rather than precise. The survey was fielded via an online panel, which may underrepresent populations with limited internet access. Self-reported spending and visit frequency are subject to recall bias. The screening criterion of having visited at least one attraction in the past 12 months means the sample represents active attraction visitors, not the general U.S. adult population.