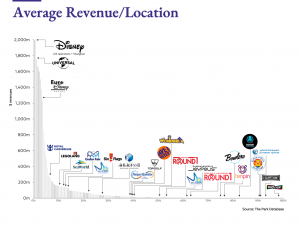
Besides the branding, what makes a Disney or Universal different from a Seaworld or Legoland? Are there true differences to speak of?
Well, based on these charts, yes.
This is the third installment in our ongoing series where we dissect the economics and characteristics of attractions. Previously, we reviewed the economics and business models of theme parks, waterparks, and other attractions. Here, we’re taking a closer look at the physical composition and guest experiences at the major theme parks.
Let’s take a closer look.
In this analysis, we’ll be using a generally acceptable set of jargon; i.e., generic terms that we believe should be generally understood by those in the attractions industry. That said, we have many readers who are not industry insiders and so before we begin, a definition of terms.
Feel free to skip if you know this already.
Glossary
- Hard Rides – As they are defined here, these are any ride attractions that are not coasters. This includes Ferris wheels, carousels, giant frisbees/disc rides, halfpipes, towers, tumblers, and so on.
- Water rides – these are rides that take place in the water, but are not waterpark rides. That is, there is a high likelihood of getting wet, but there are ride vehicles in the form of rafts, flumes, or tubes and do not end in riders being completely submerged in pools. These include examples such as Jurassic Park at Universal Studios or Splash Mountain at Disney.
- Kids rides – these are basically smaller versions of their adult equivalents.
- Explore and Play areas – these are any type of attraction where guests interact or move through the environment themselves, rather than being propelled by a vehicle. This is a large and varied category including playgrounds, Lego build experiences, animal interaction experiences, environmental and landscape design elements.
- Dark rides – rides or coasters that take place almost entirely indoors, in a climate-controlled and media-rich environment. Vehicle types range from boats to moving seats to coasters. Think Buzz Lightyear or Harry Potter.
- Attraction inventory count – this is simply the number of individual rides and experience at a given park, per category.
- Attraction inventory capacity – this is an important concept in planning a theme park. This goes by various names, including throughput, theoretical hourly capacity, or simply capacity. This is a measure of the number of experiences that either a single ride or attraction, or the entire theme park, can deliver to guests in one hour.When we speak of a ride’s hourly capacity, that is the number of people who can theoretically ride the attraction in one (1) hour. A theme park’s hourly capacity is the number of discrete experiences that the entire park can deliver in an hour. This is calculated by taking the sum of each individual attraction’s hourly capacity.
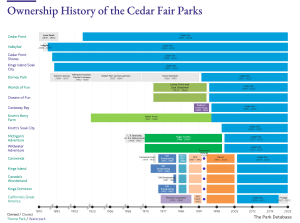
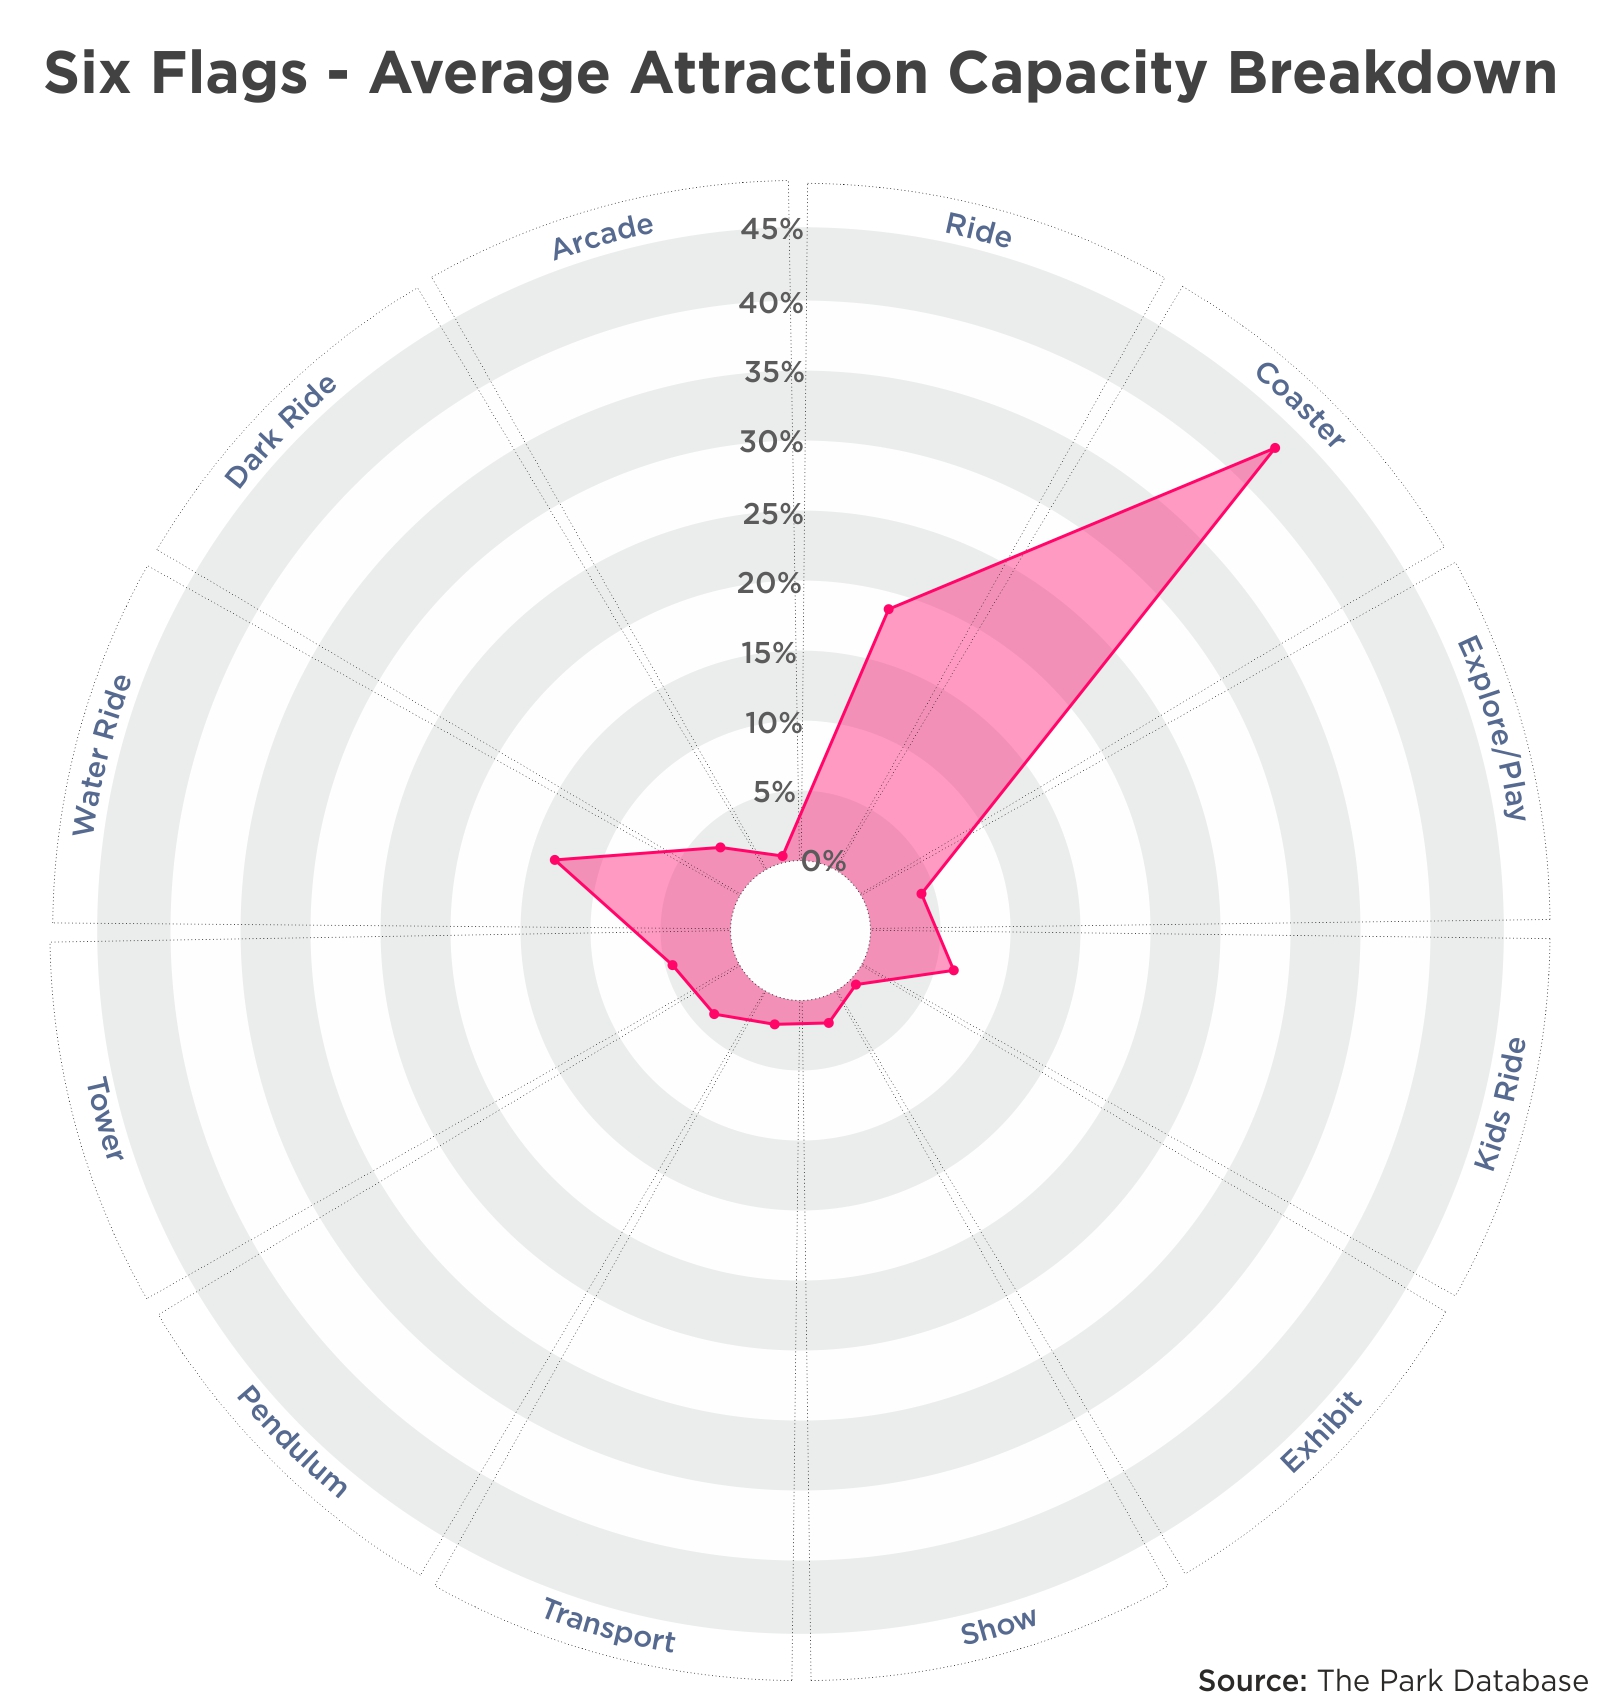
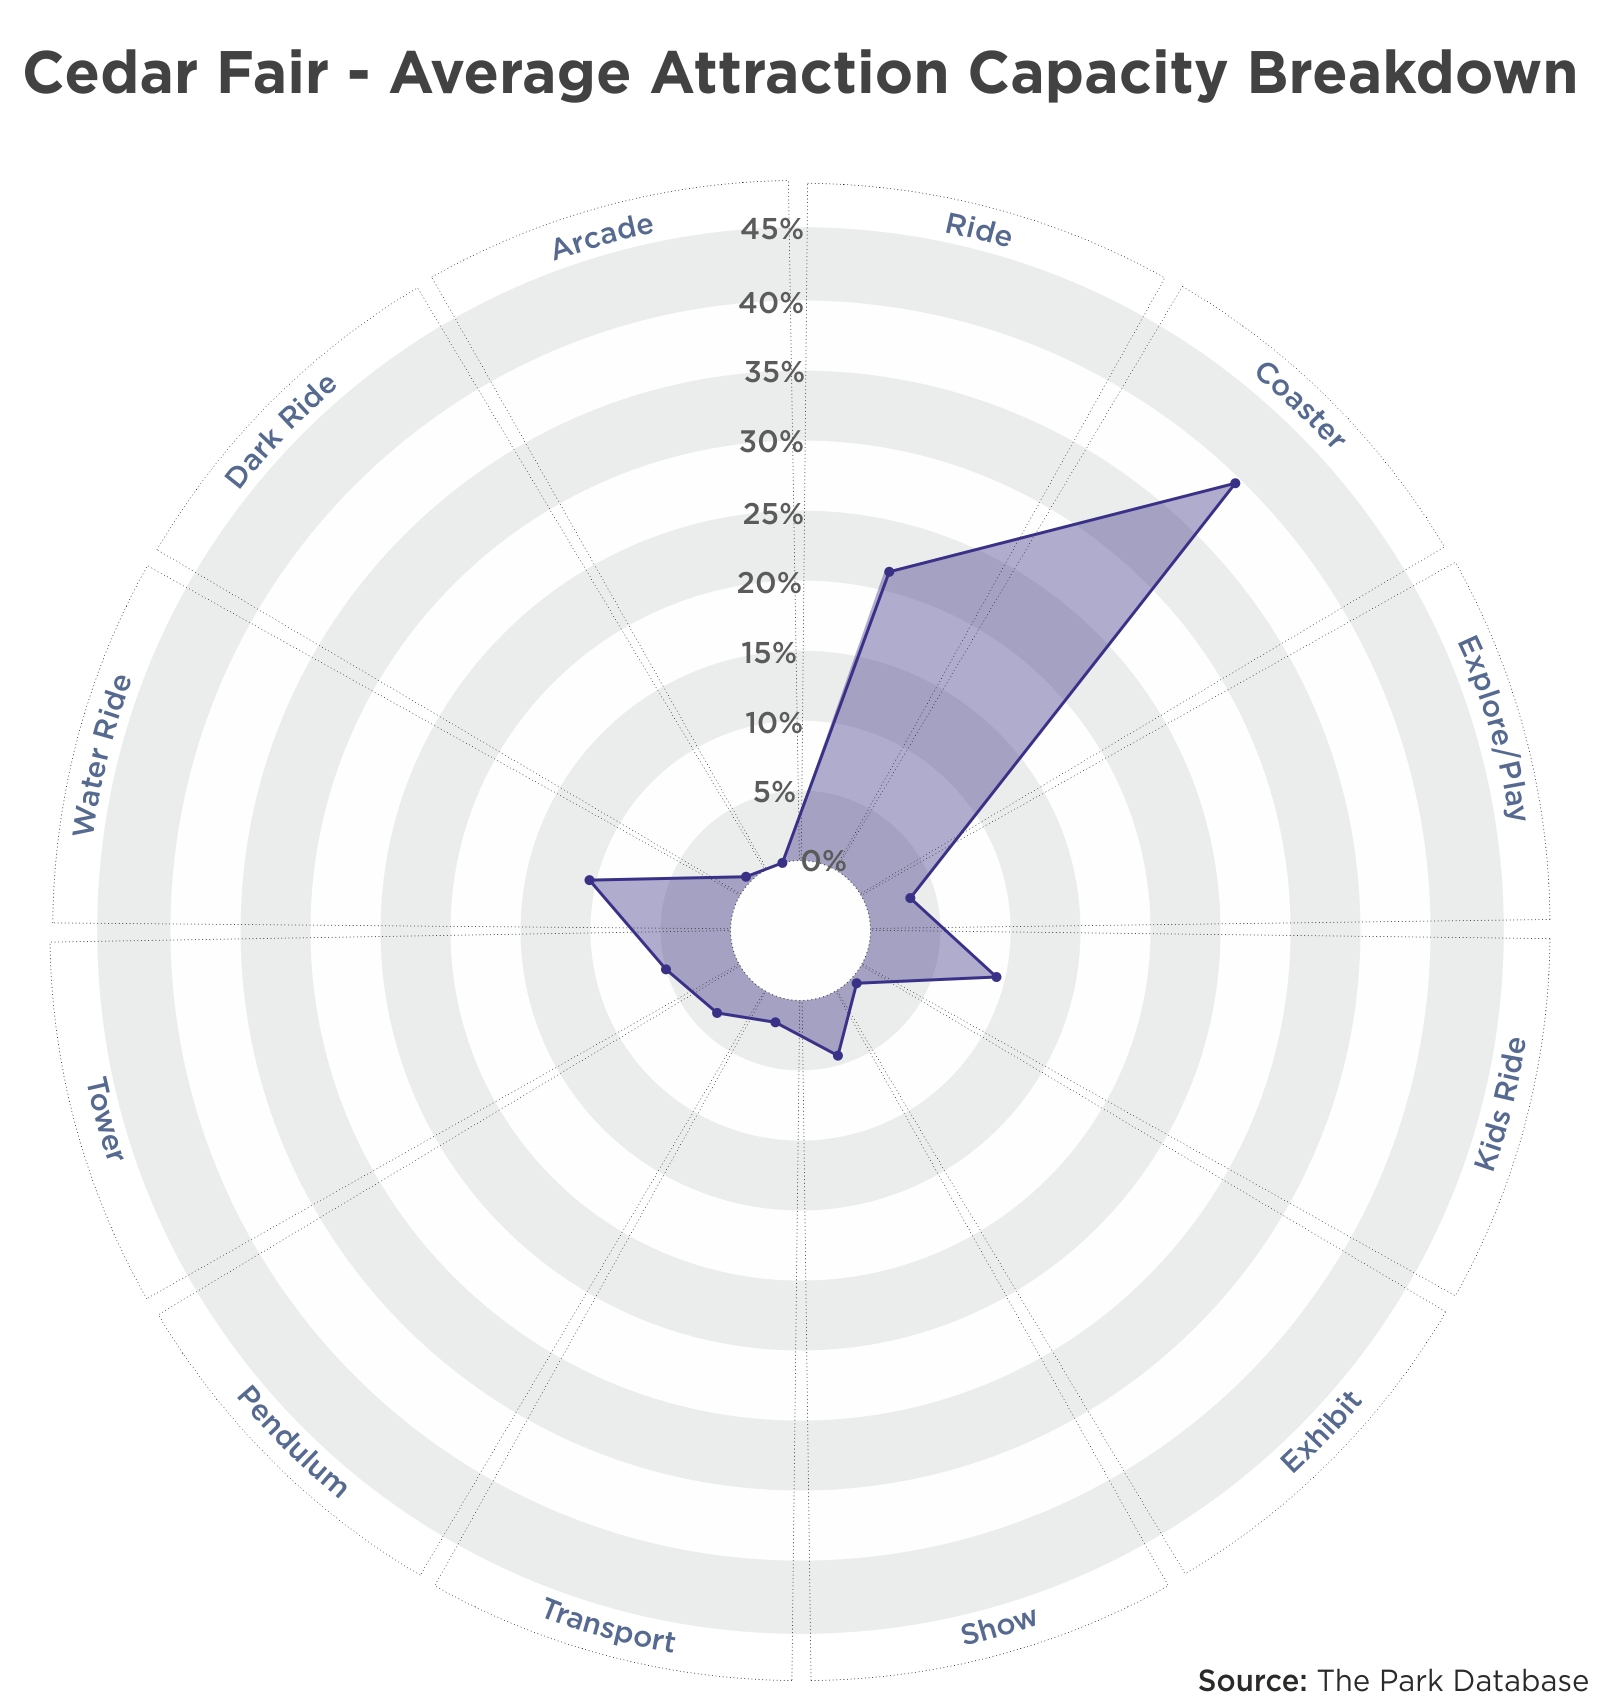
Cedar Fair & Six Flags – Signature
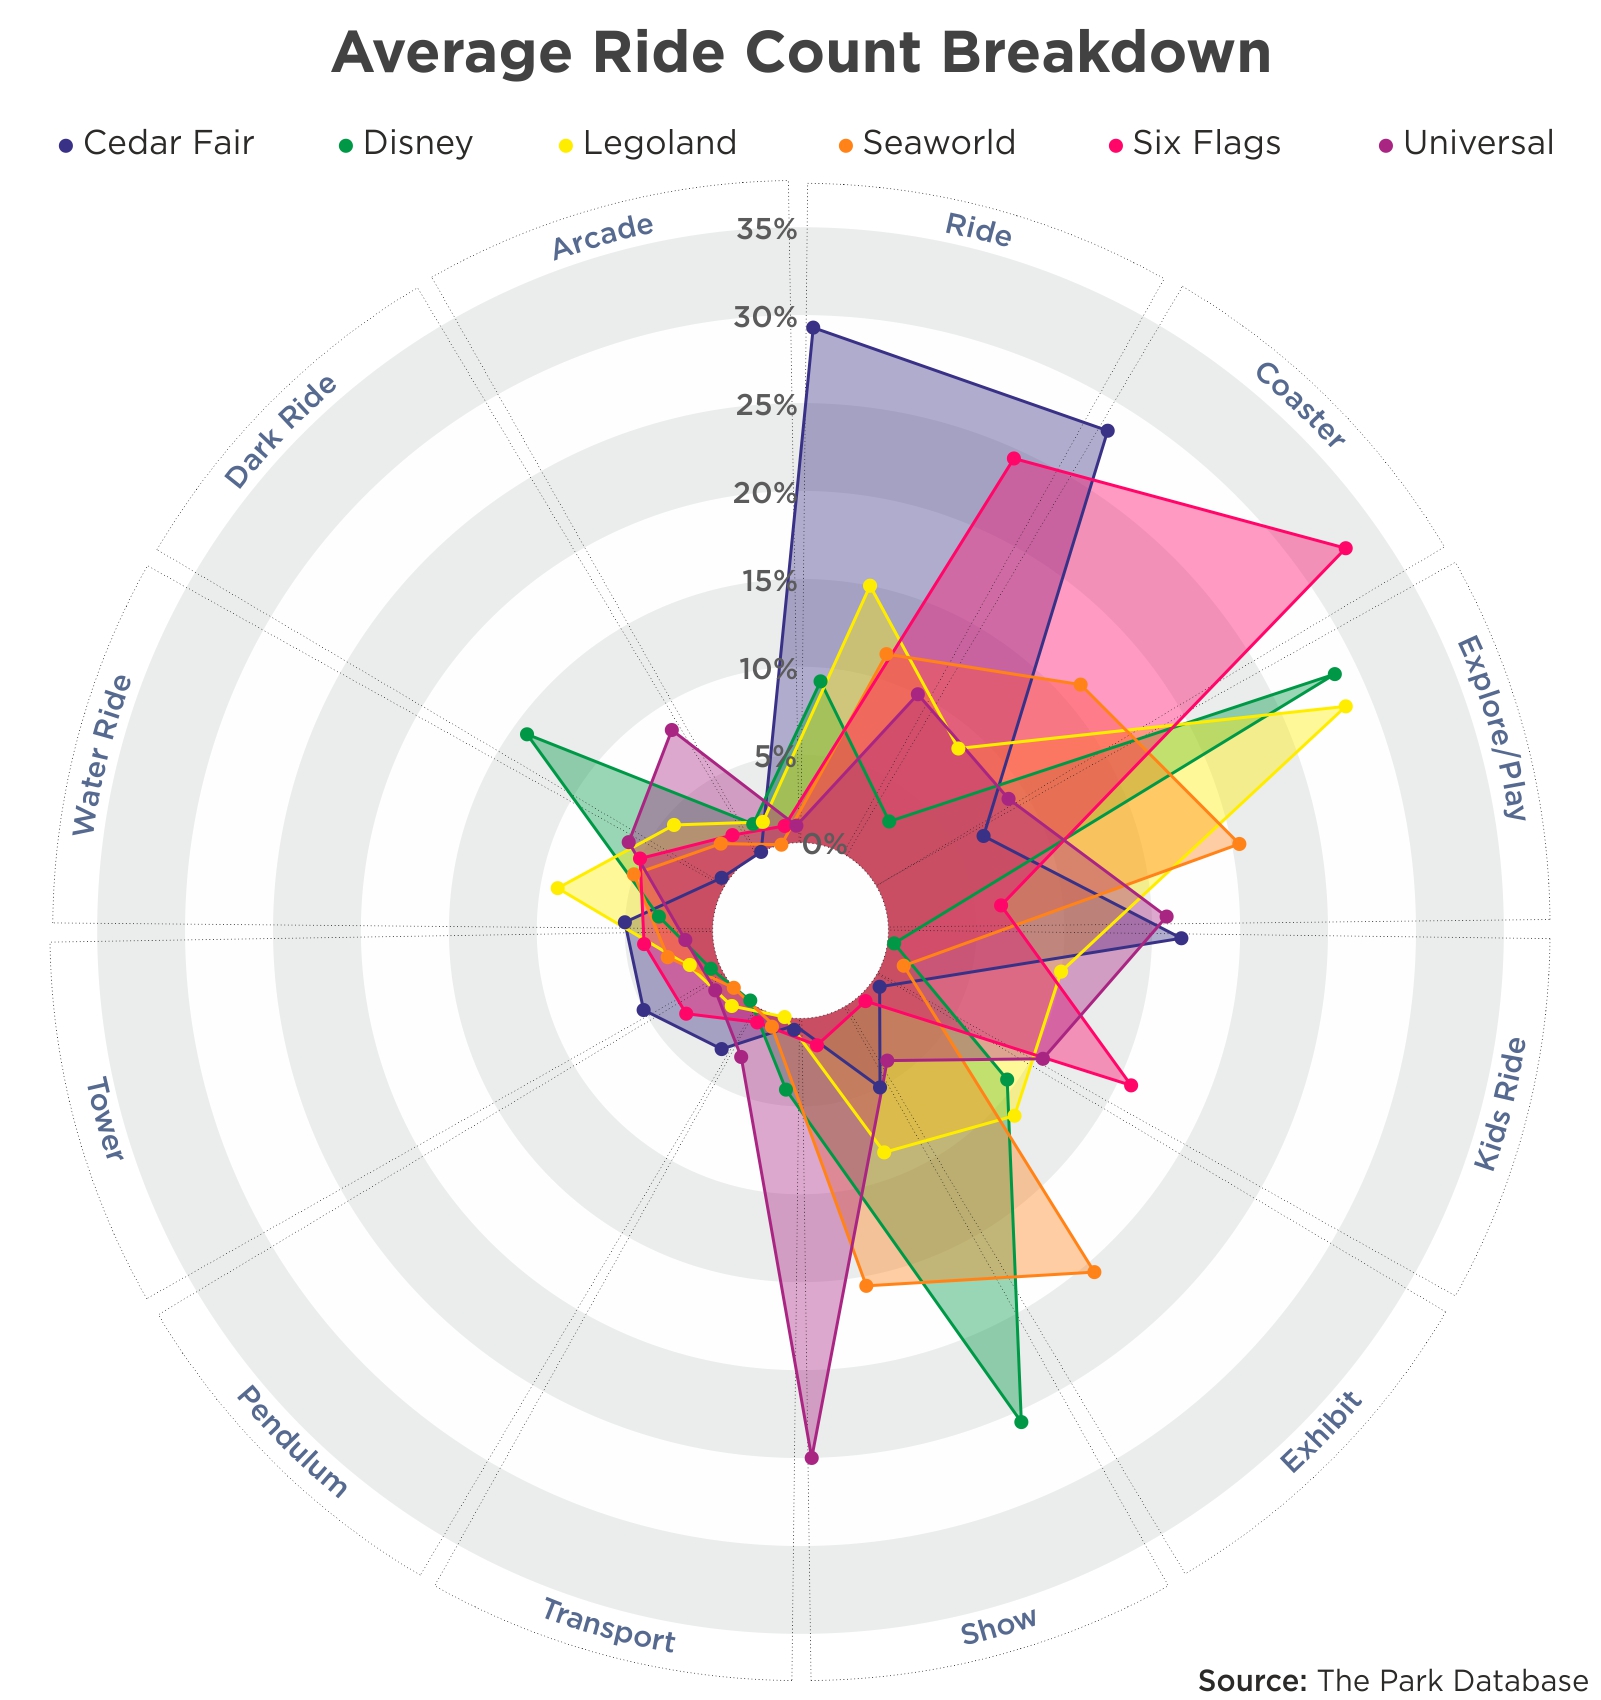
We’ve grouped these park chains together because, for better or worse, their signature is nearly identical. With nearly 60% of the park attraction count composed of hard rides and coasters, these two park brands are truly ride parks.
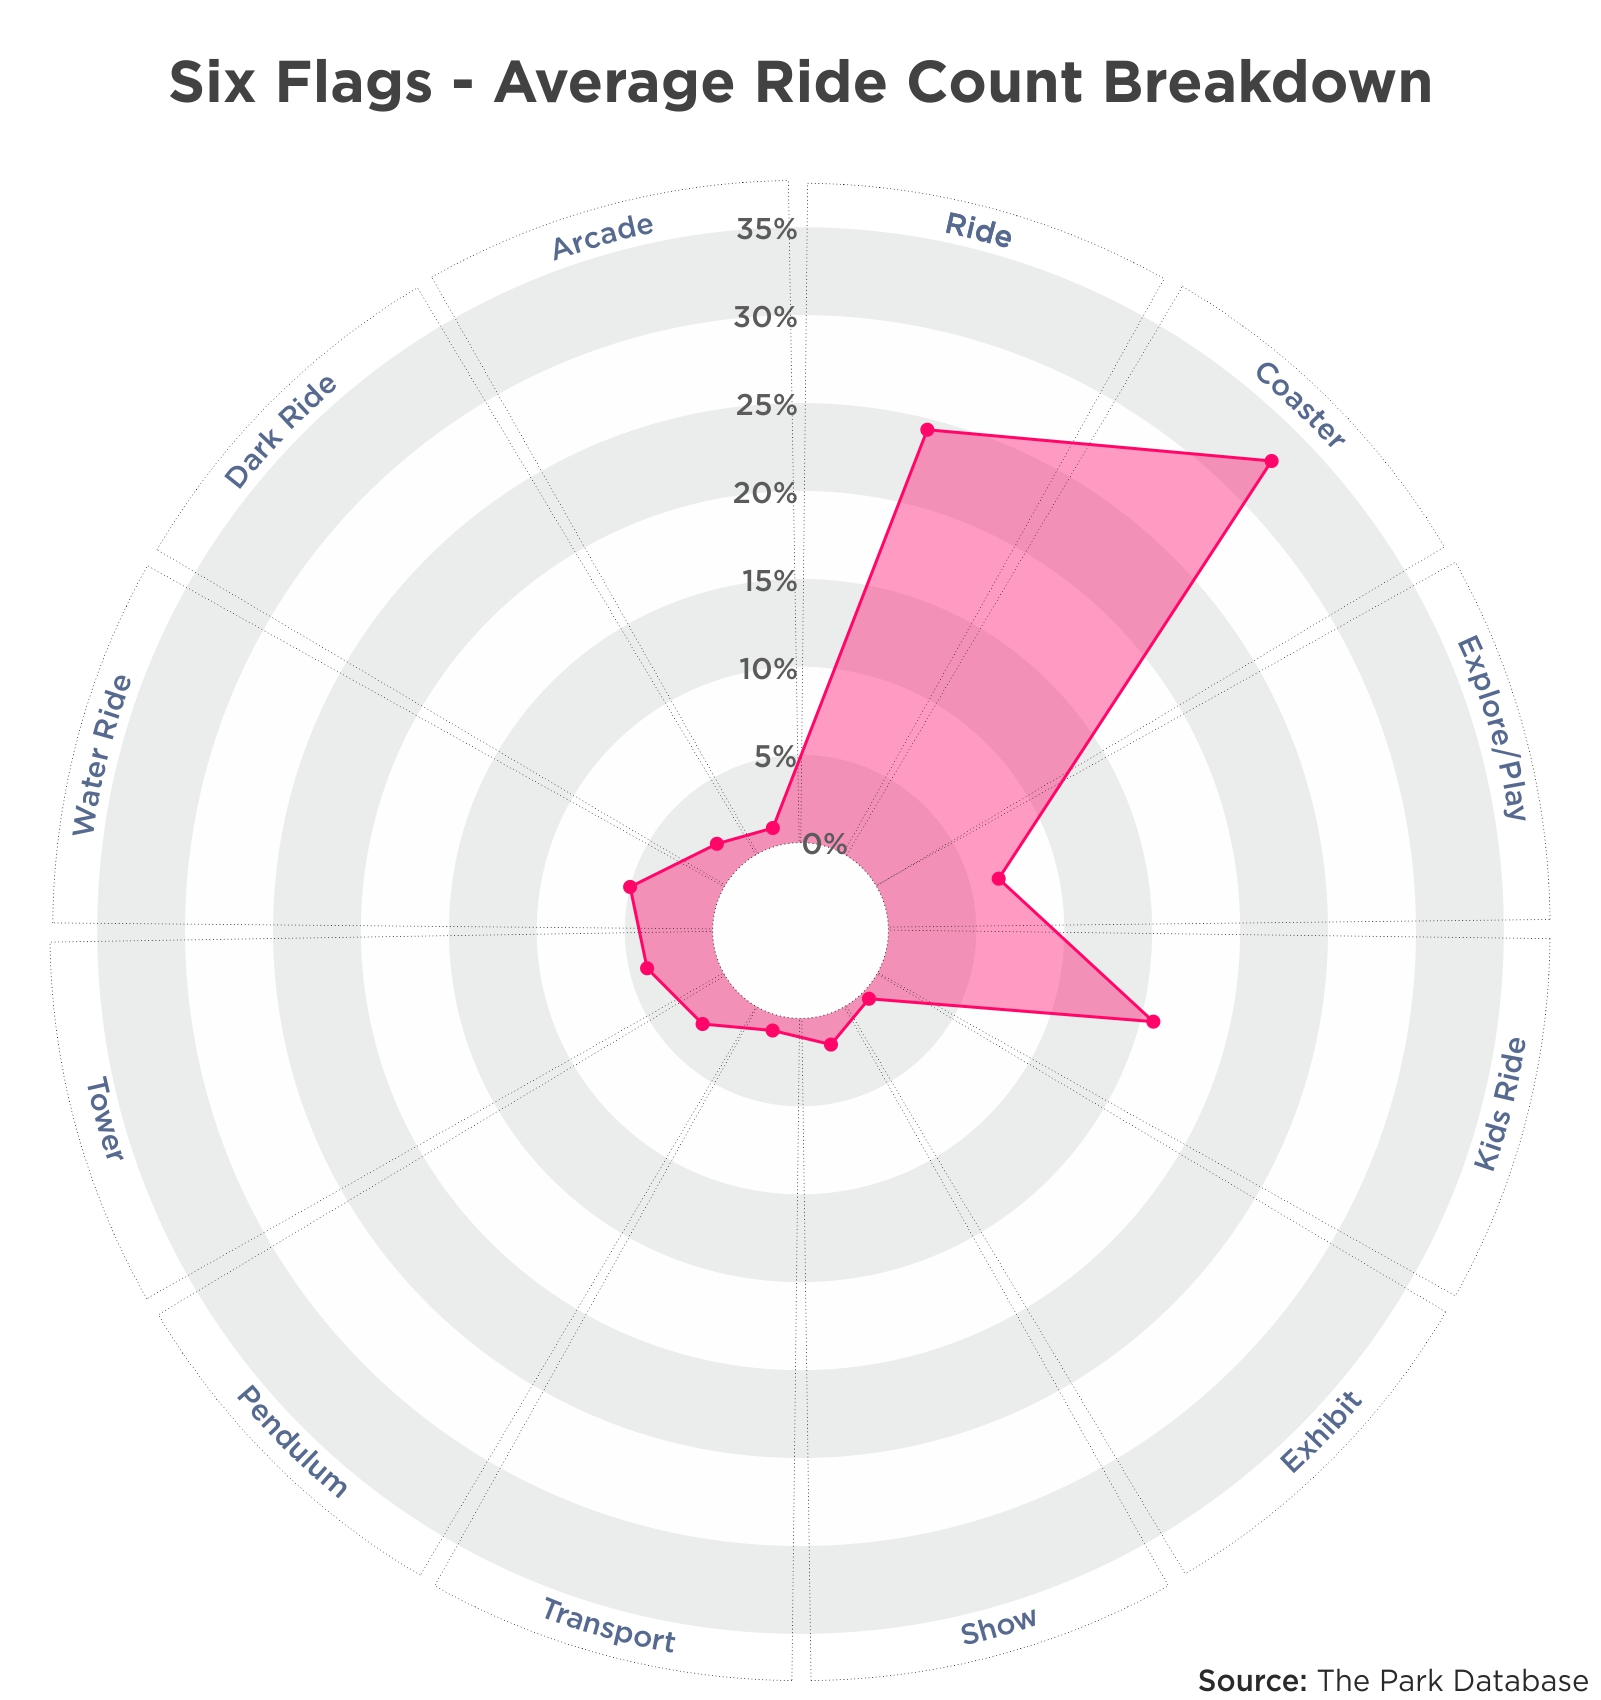
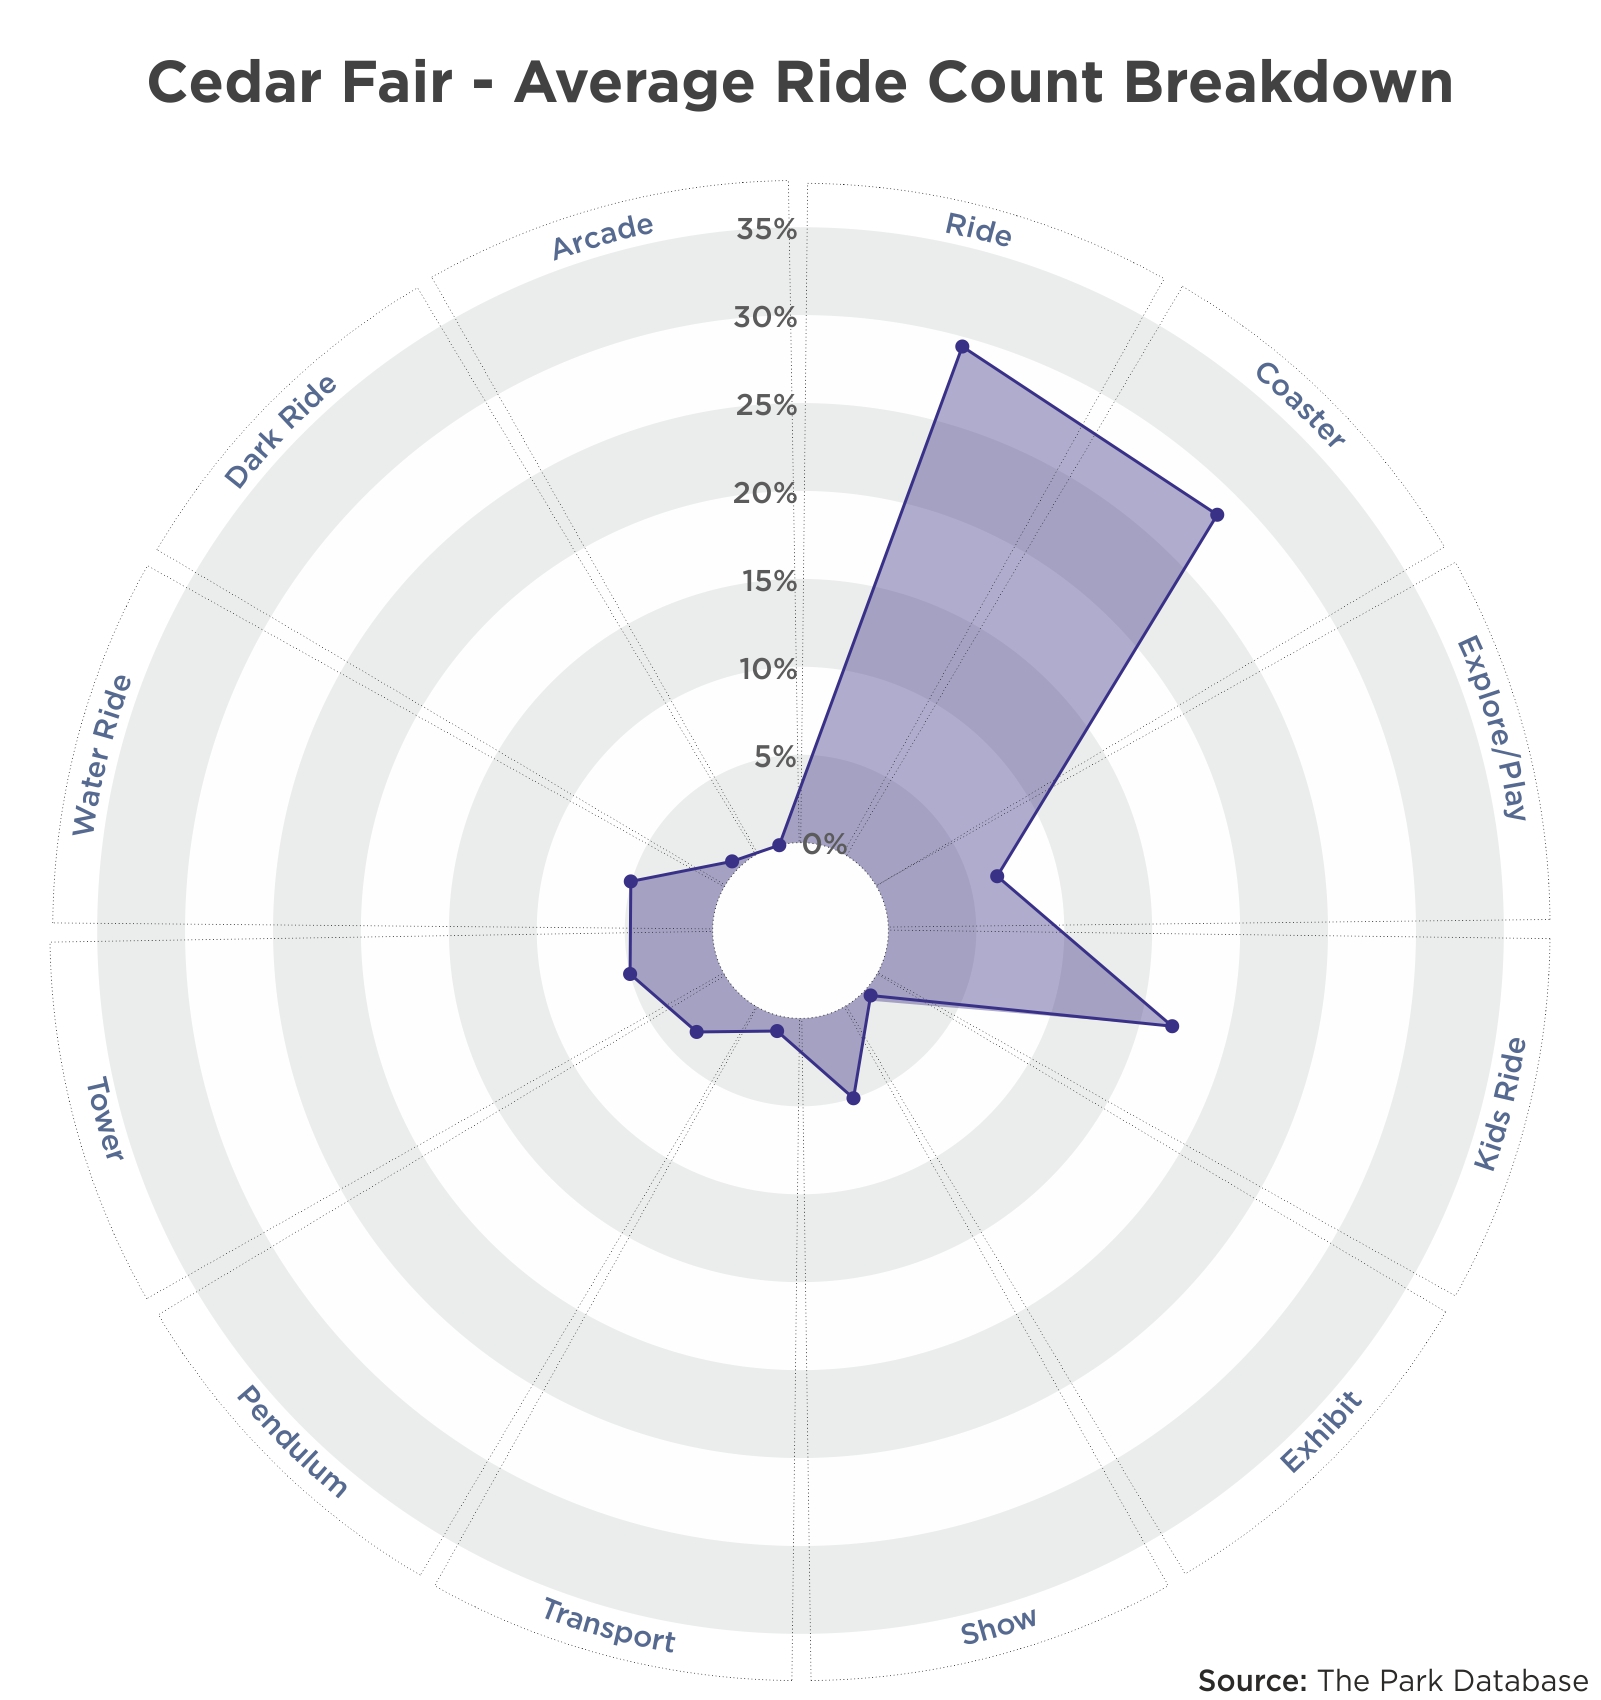
Note that Six Flags has slightly more of its inventory dedicated to coasters than does Cedar Fair, which has a more balanced representation of hard rides and coasters.
- Half of the remaining attraction mix count, at both parks, is dedicated to water rides and kids rides.
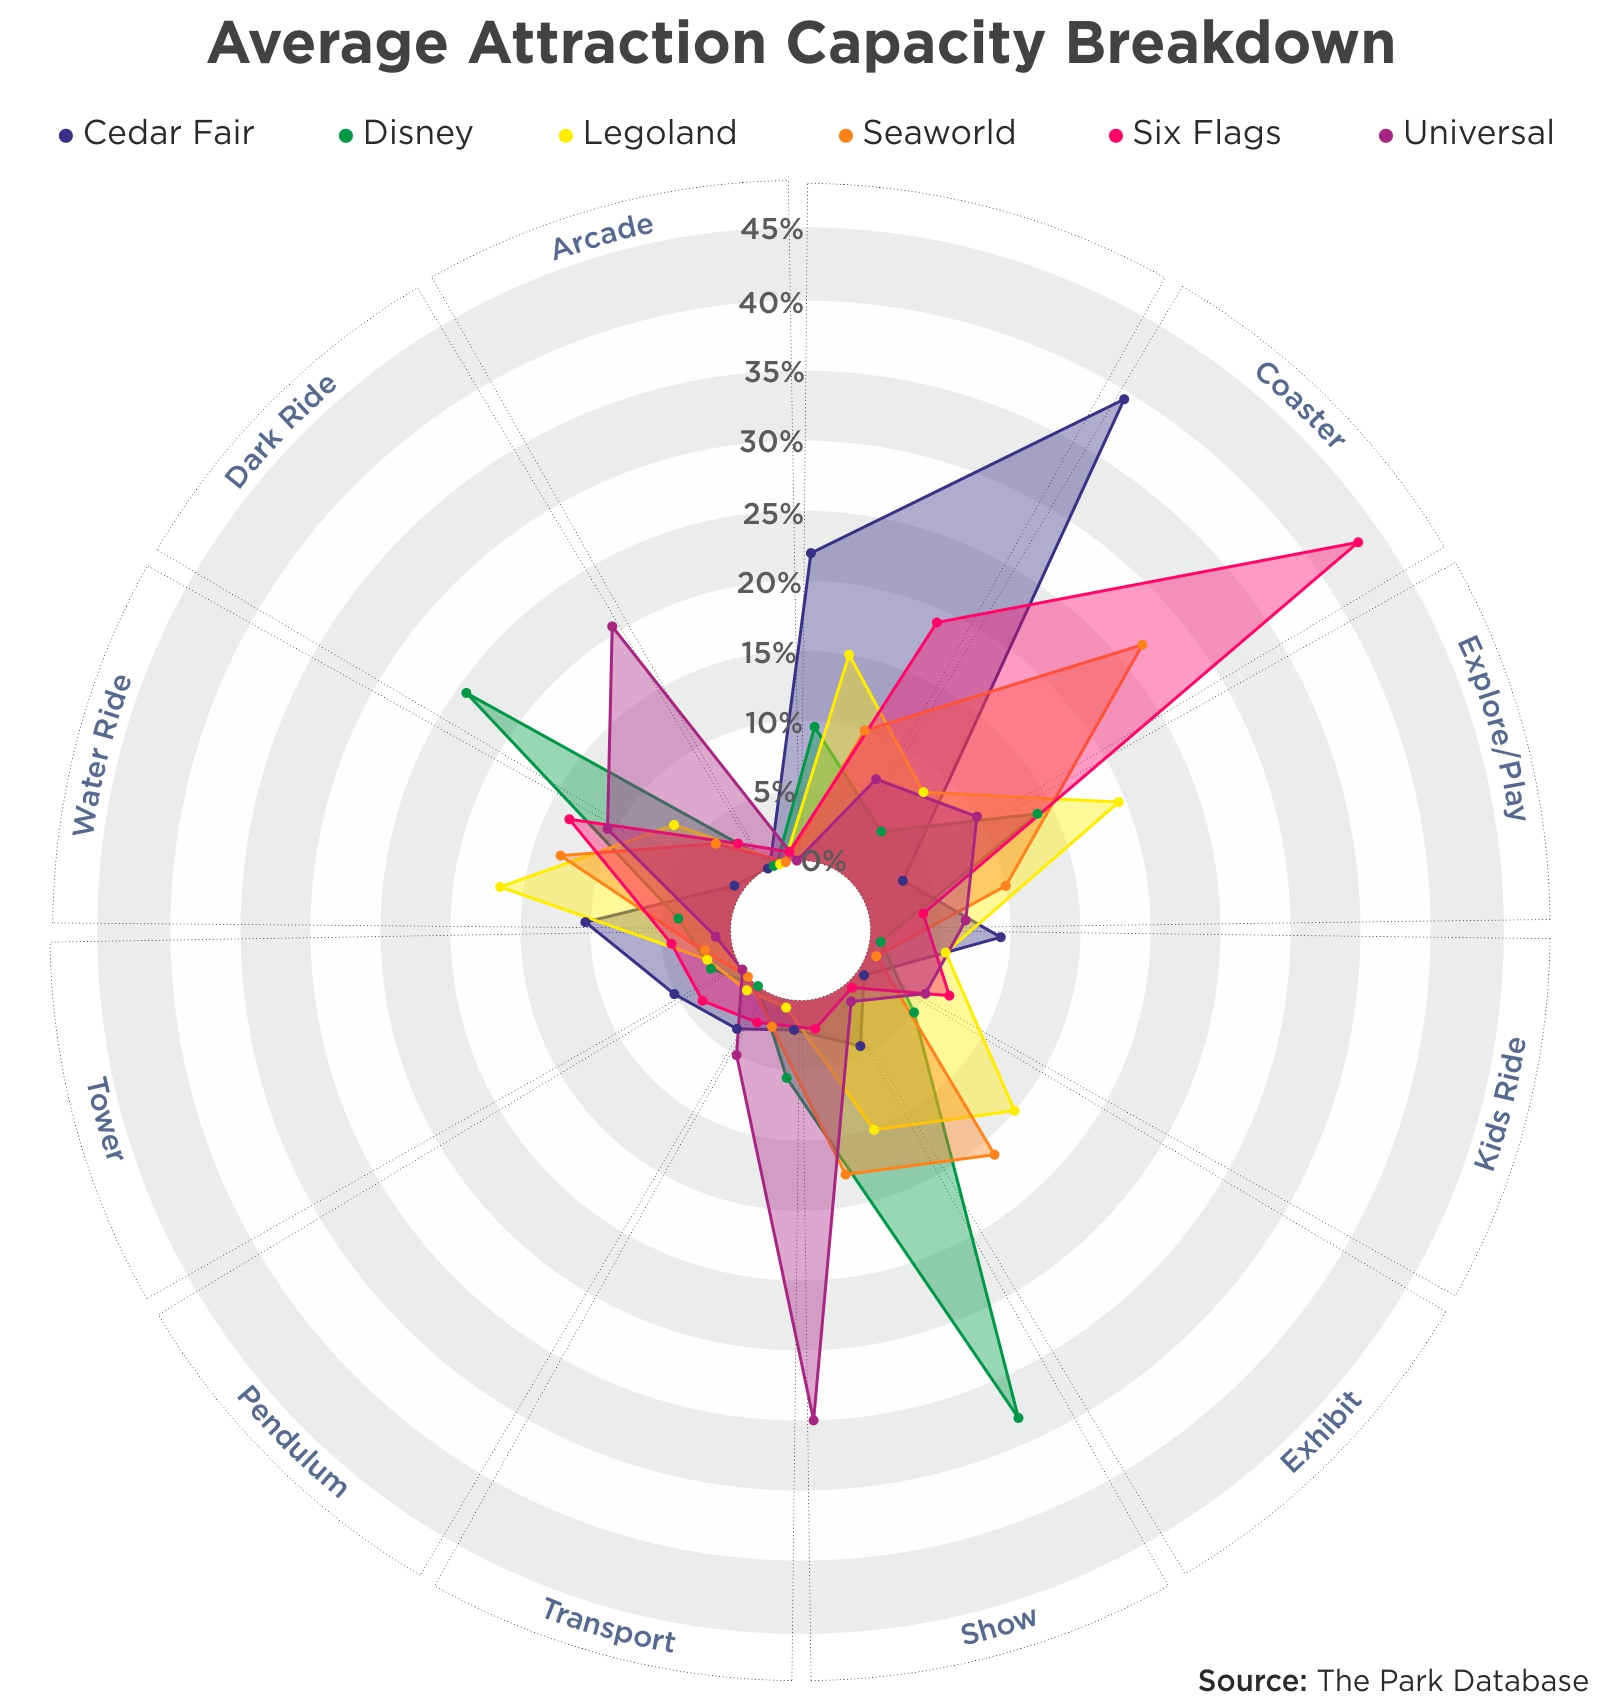
- When we look at capacity (below), however, it is nearly the same except for one interesting detail: even though the sheer count of water rides is lower than other categories, such as kids rides, we see that the actual capacity of the water rides is much higher.
- This speaks to the nature of water rides as high capacity attractions.
This next set of parks is interesting for their contrast to ride parks. While in common perception, we know that Disney and Universal Studios parks are not exactly ride parks, it is hard to define exactly what they are.
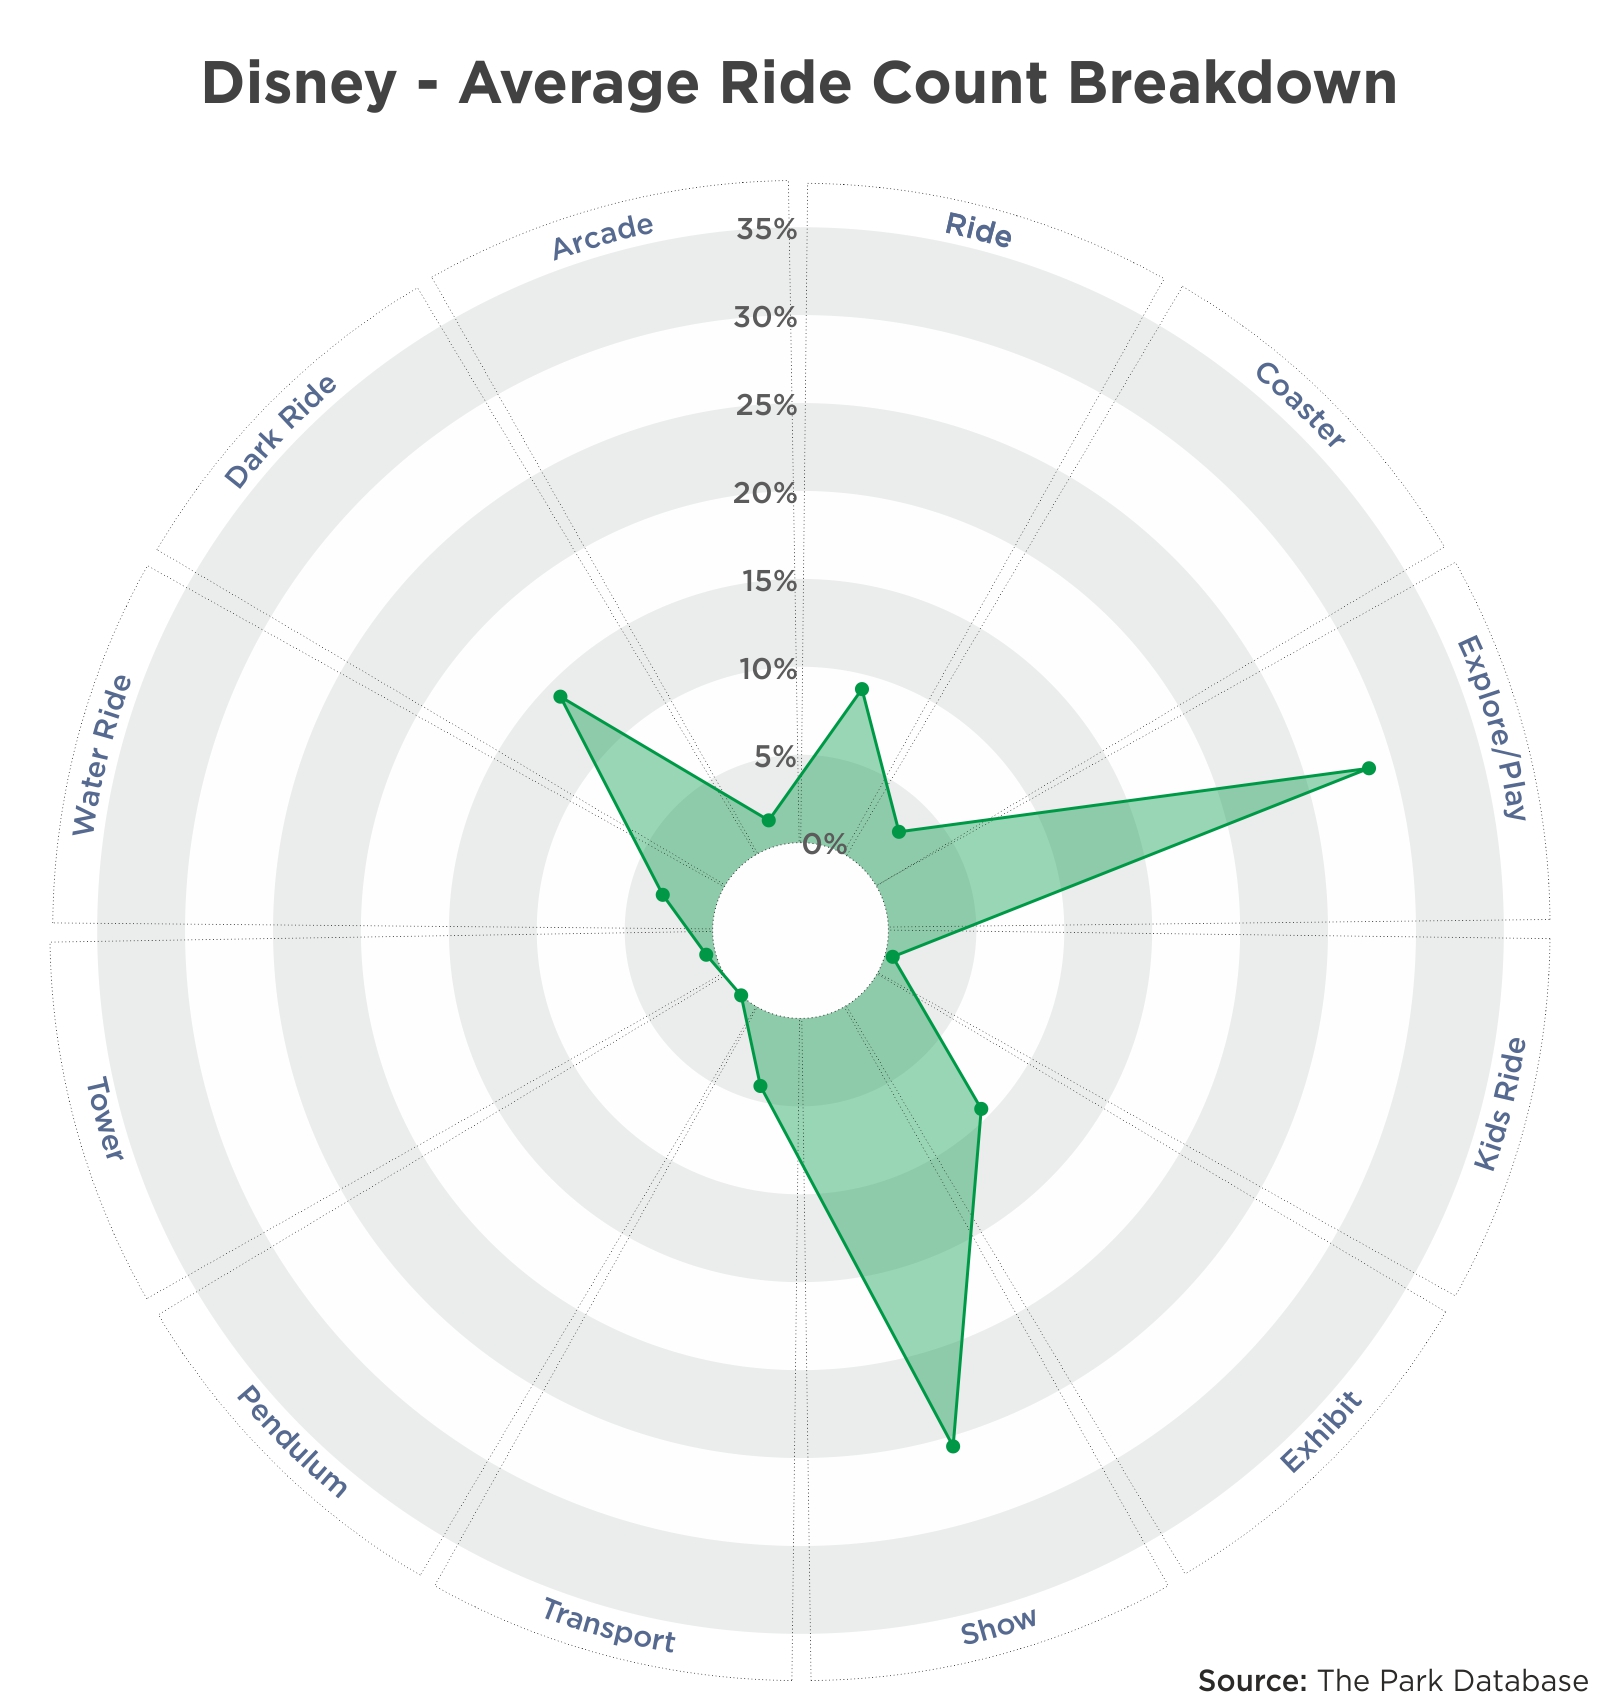
Disney – Signature
What a Disney park is, exactly, is almost the exact reverse of a ride park. Coasters are de-emphasized, and instead, shows, explore areas and play structures, and dark rides dominate.
- 50% of the raw inventory count is composed of explore areas, play structures, and shows. This includes the character greetings available at the Disney parks, both seated and live street shows, parades, fireworks shows, and various explore areas such as Snow White’s grotto or Sleeping Beauty’s castle scattered throughout the parks.
- Environment-controlled dark rides are a main feature of Disney parks. This includes traditional rides such as It’s a Small World, Pooh’s Hunny Hunt, Peter Pan’s Flight, as well as the modern man-eaters, like the Buzz Lightyear rides, Mystic Manor, or Pirates of the Caribbean.
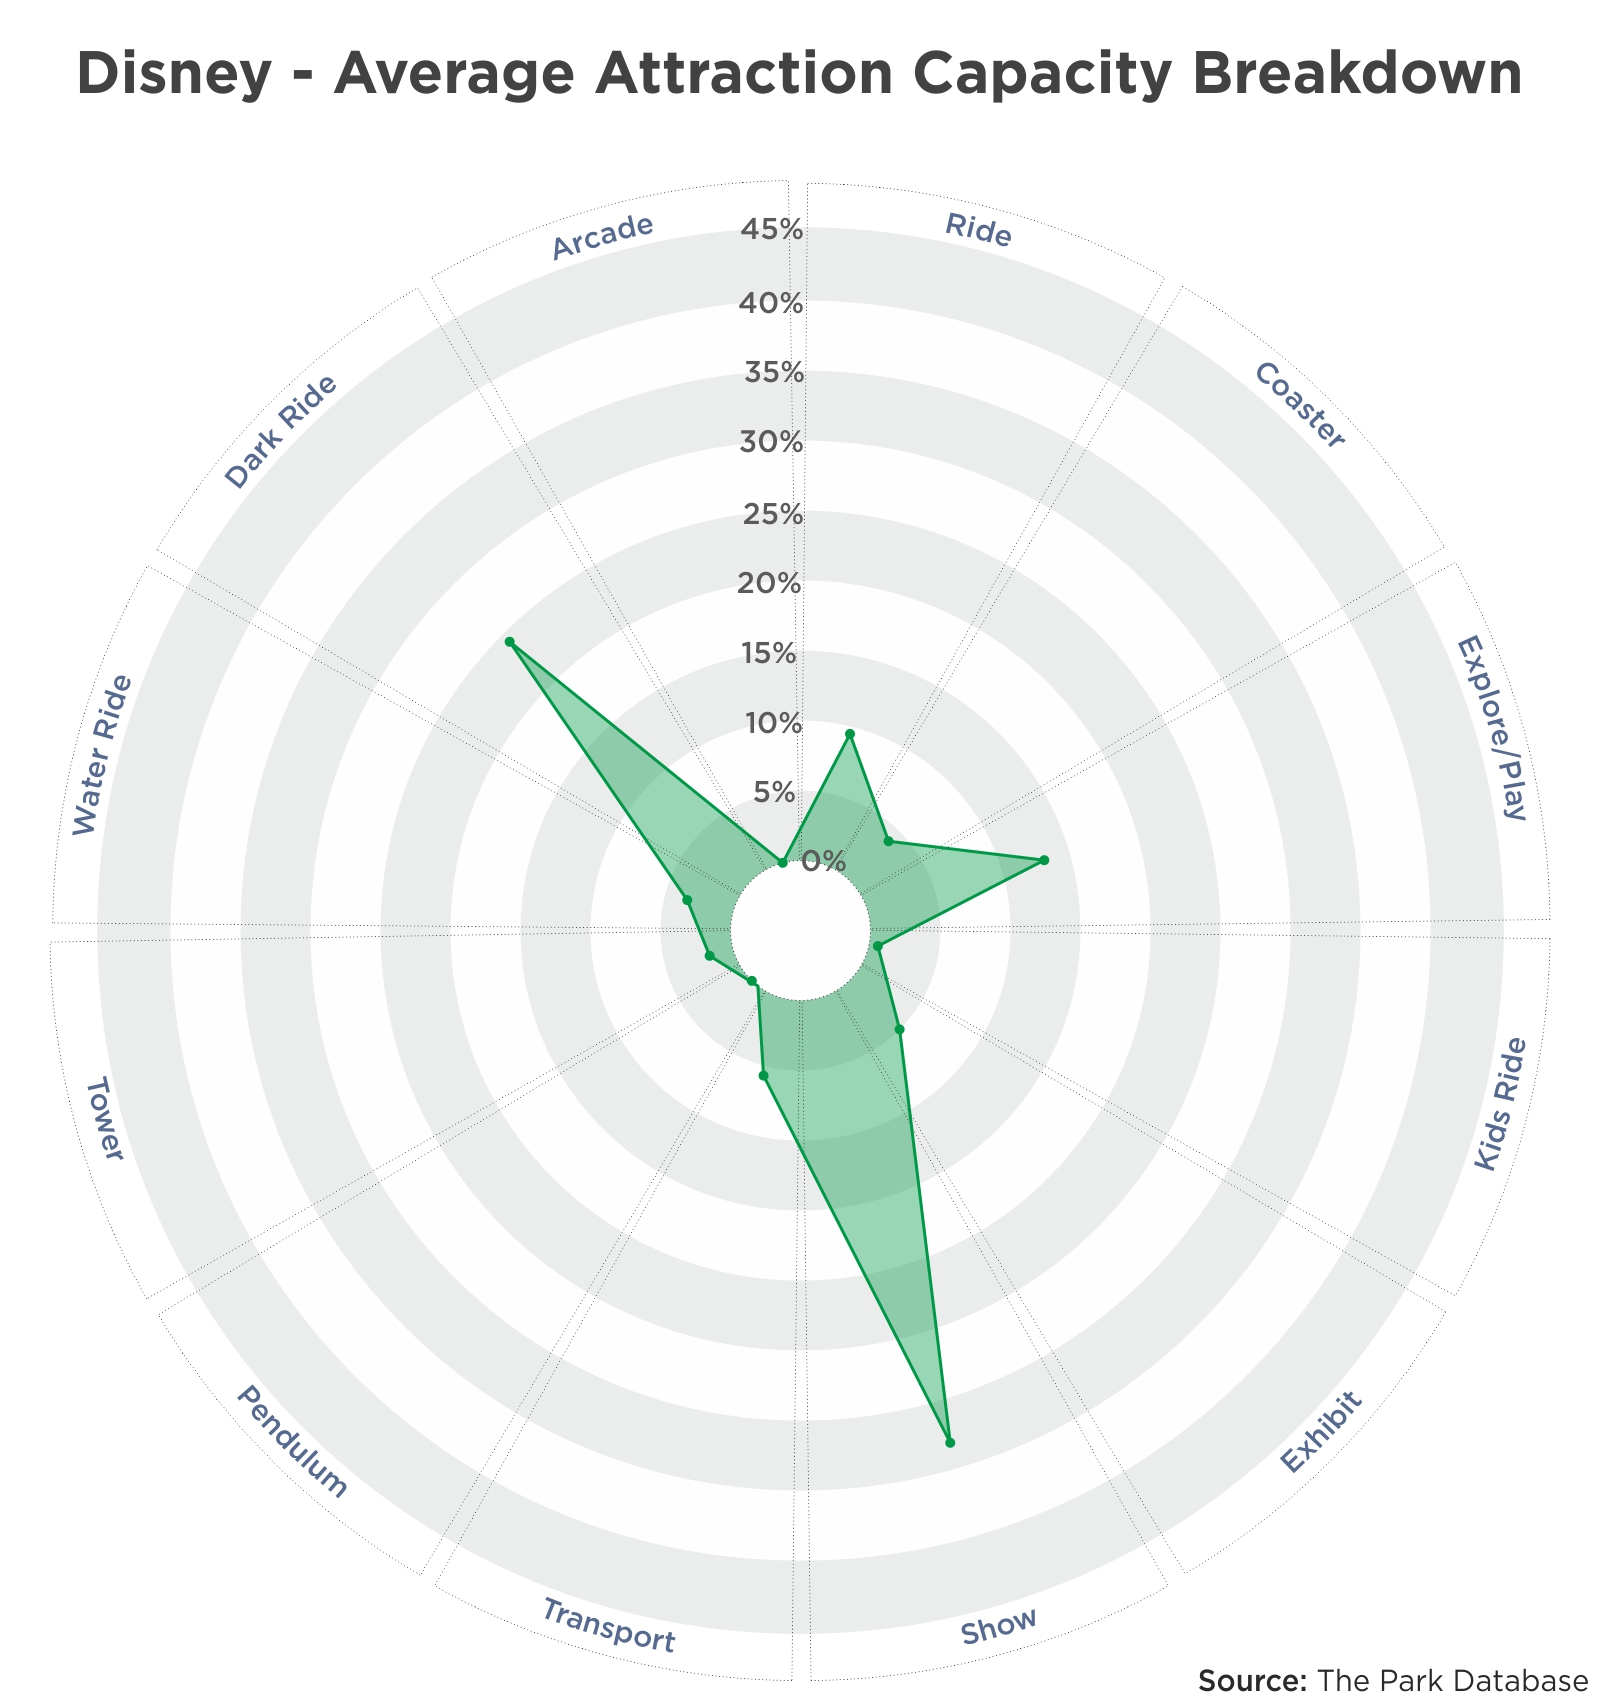
As with the ride parks, there is a difference between ride count and ride capacity. When we look at capacity, we see that shows are the single largest category of attraction capacity at a Disney park. With the parades and firework shows, this category comprises over one-third of Disney park capacity, with dark rides second at 25%, and explore areas and play structures slightly under 15%.
Universal Studios
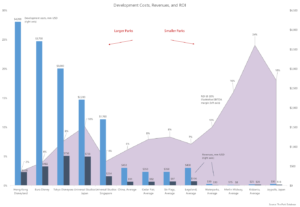
Universal Studios – well, it’s similar to a Disney park. As we’ve written repeatedly, Disney and Universal are in a class by themselves when it comes to their business model, the sheer scale of their construction costs, and corresponding revenues. And when we examine their attraction inventory signature, it’s almost identical.
The higher number here, compared to Disney, along the ‘coaster’ metric is actually due simply to the inclusion of PortAventura, which has more coasters and rides than a typical Universal park.
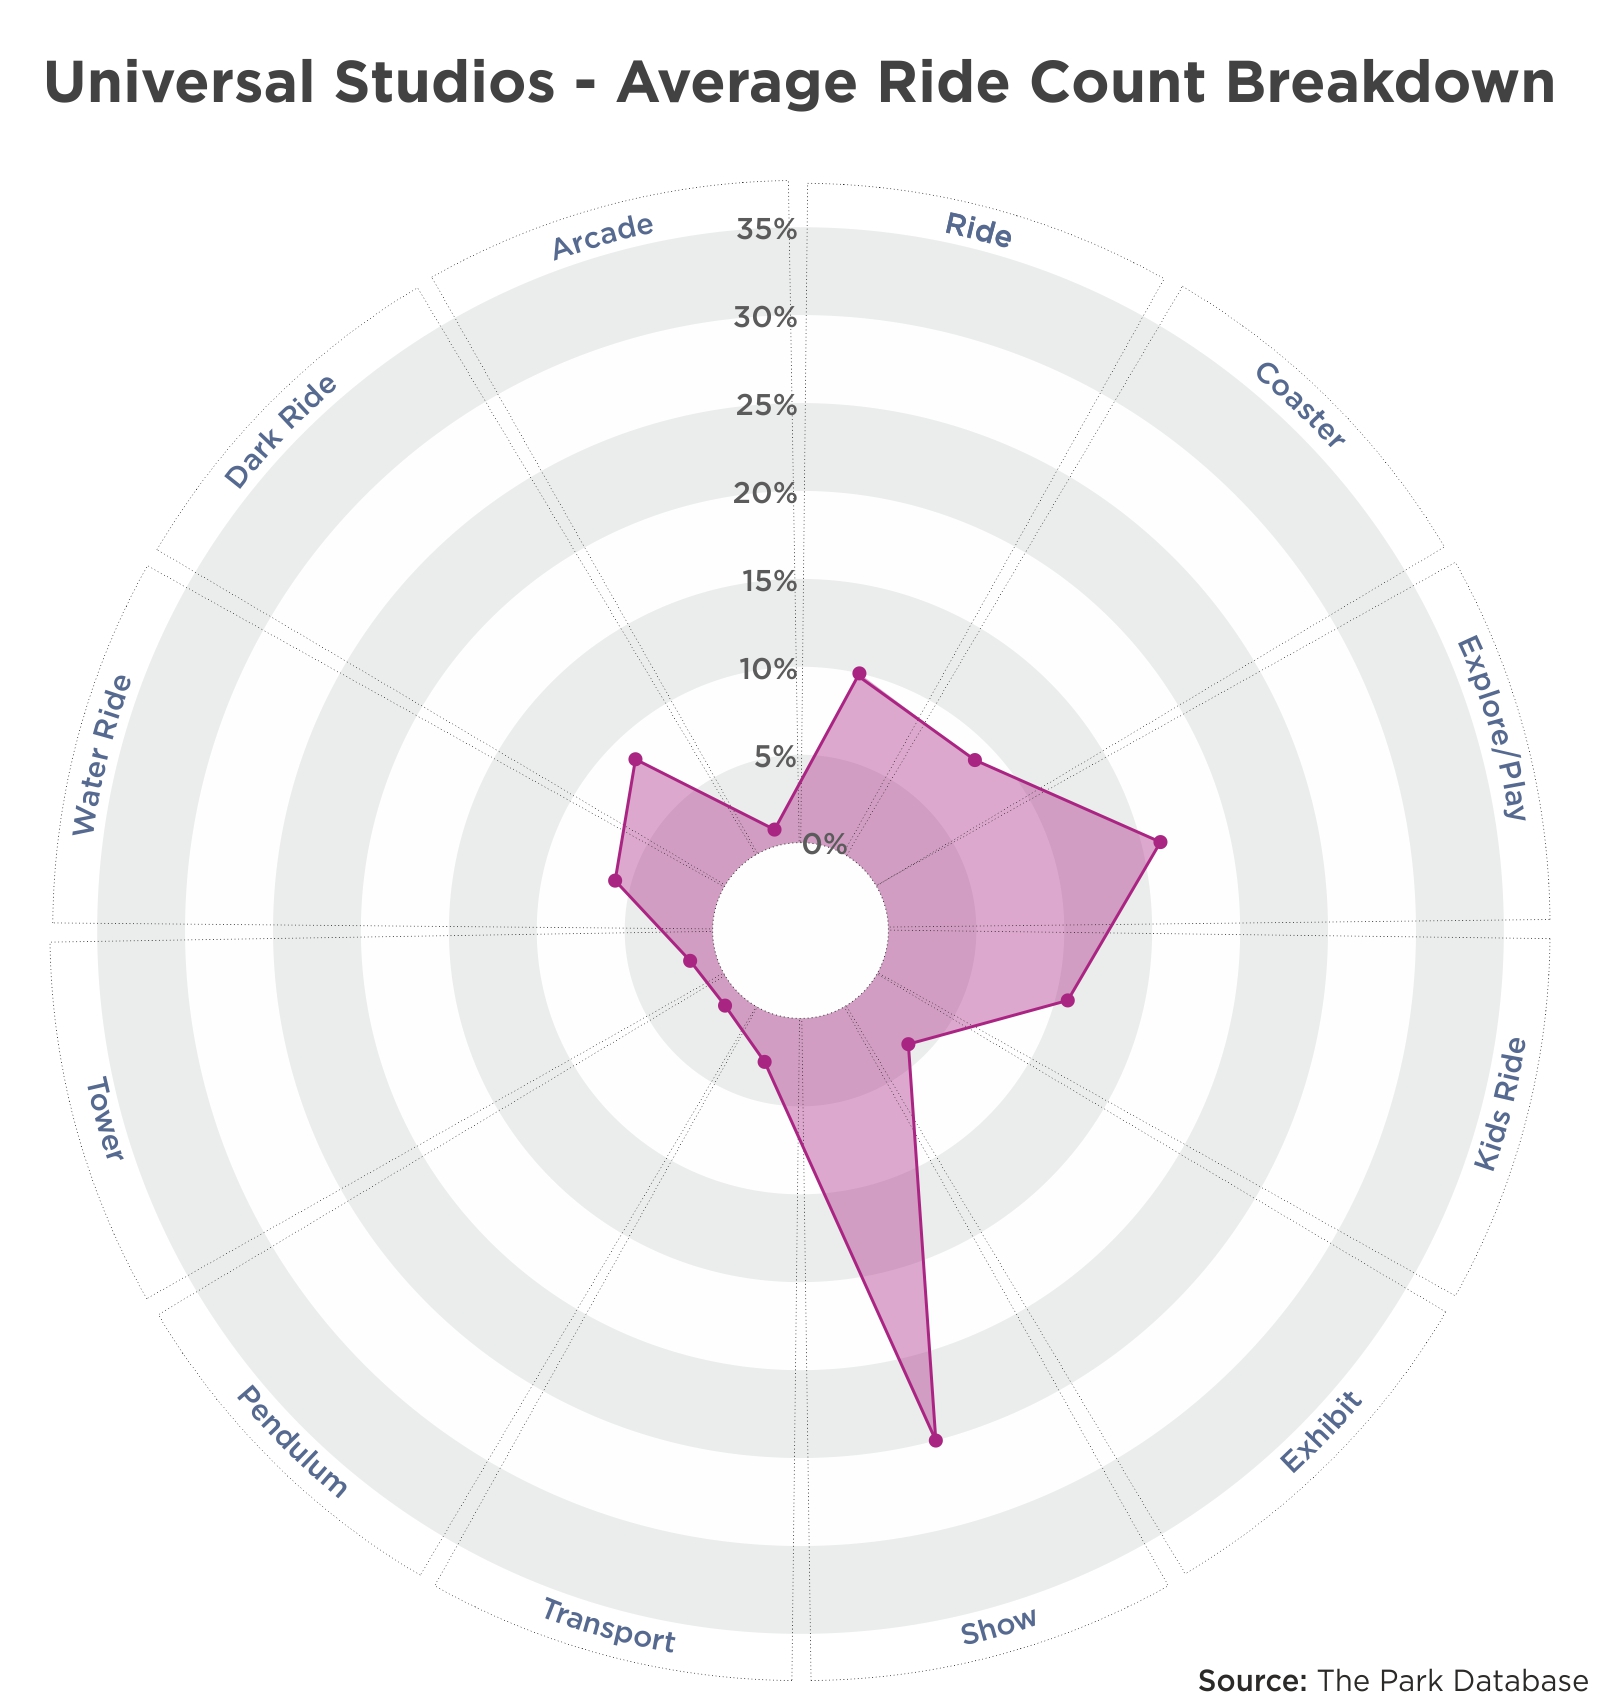
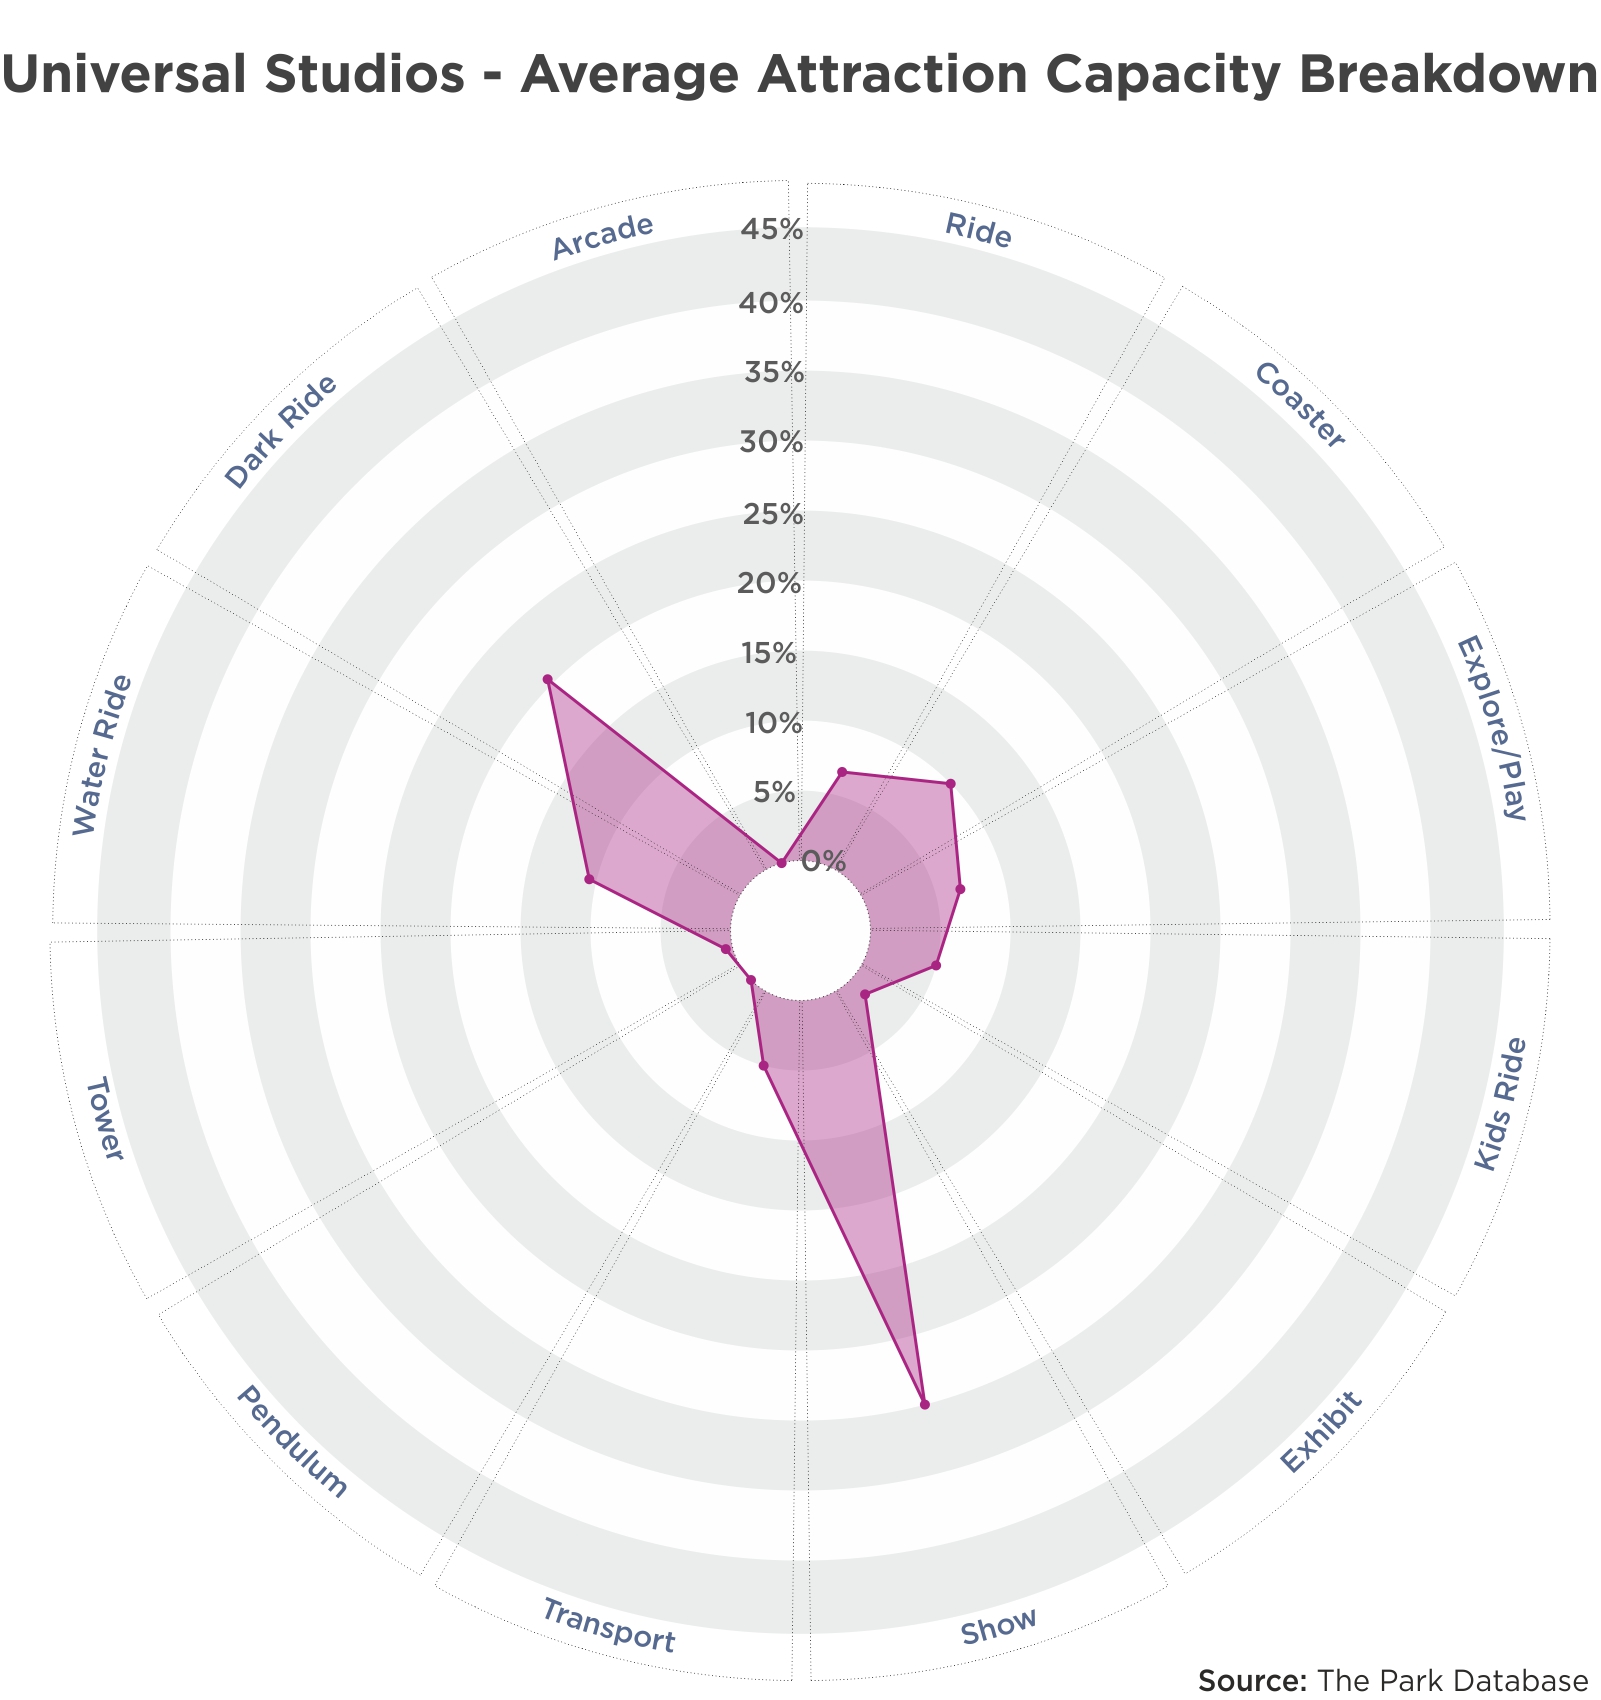
While we care not to speculate whether this similarity in attraction mix is intentional or not, this point is worth some contemplation by other operators or would-be developers.
An attraction mix of this nature widens the audience, with families of younger children and toddlers able to attend. Without an overemphasis on thrill rides, attractions of a scenic nature, and shows, guests of older ages will find something for them as well. It simply broadens the target market, which might be among the reasons why both Disney and Universal have the highest-attended parks in the world. Worth considering.
Legoland – Signature
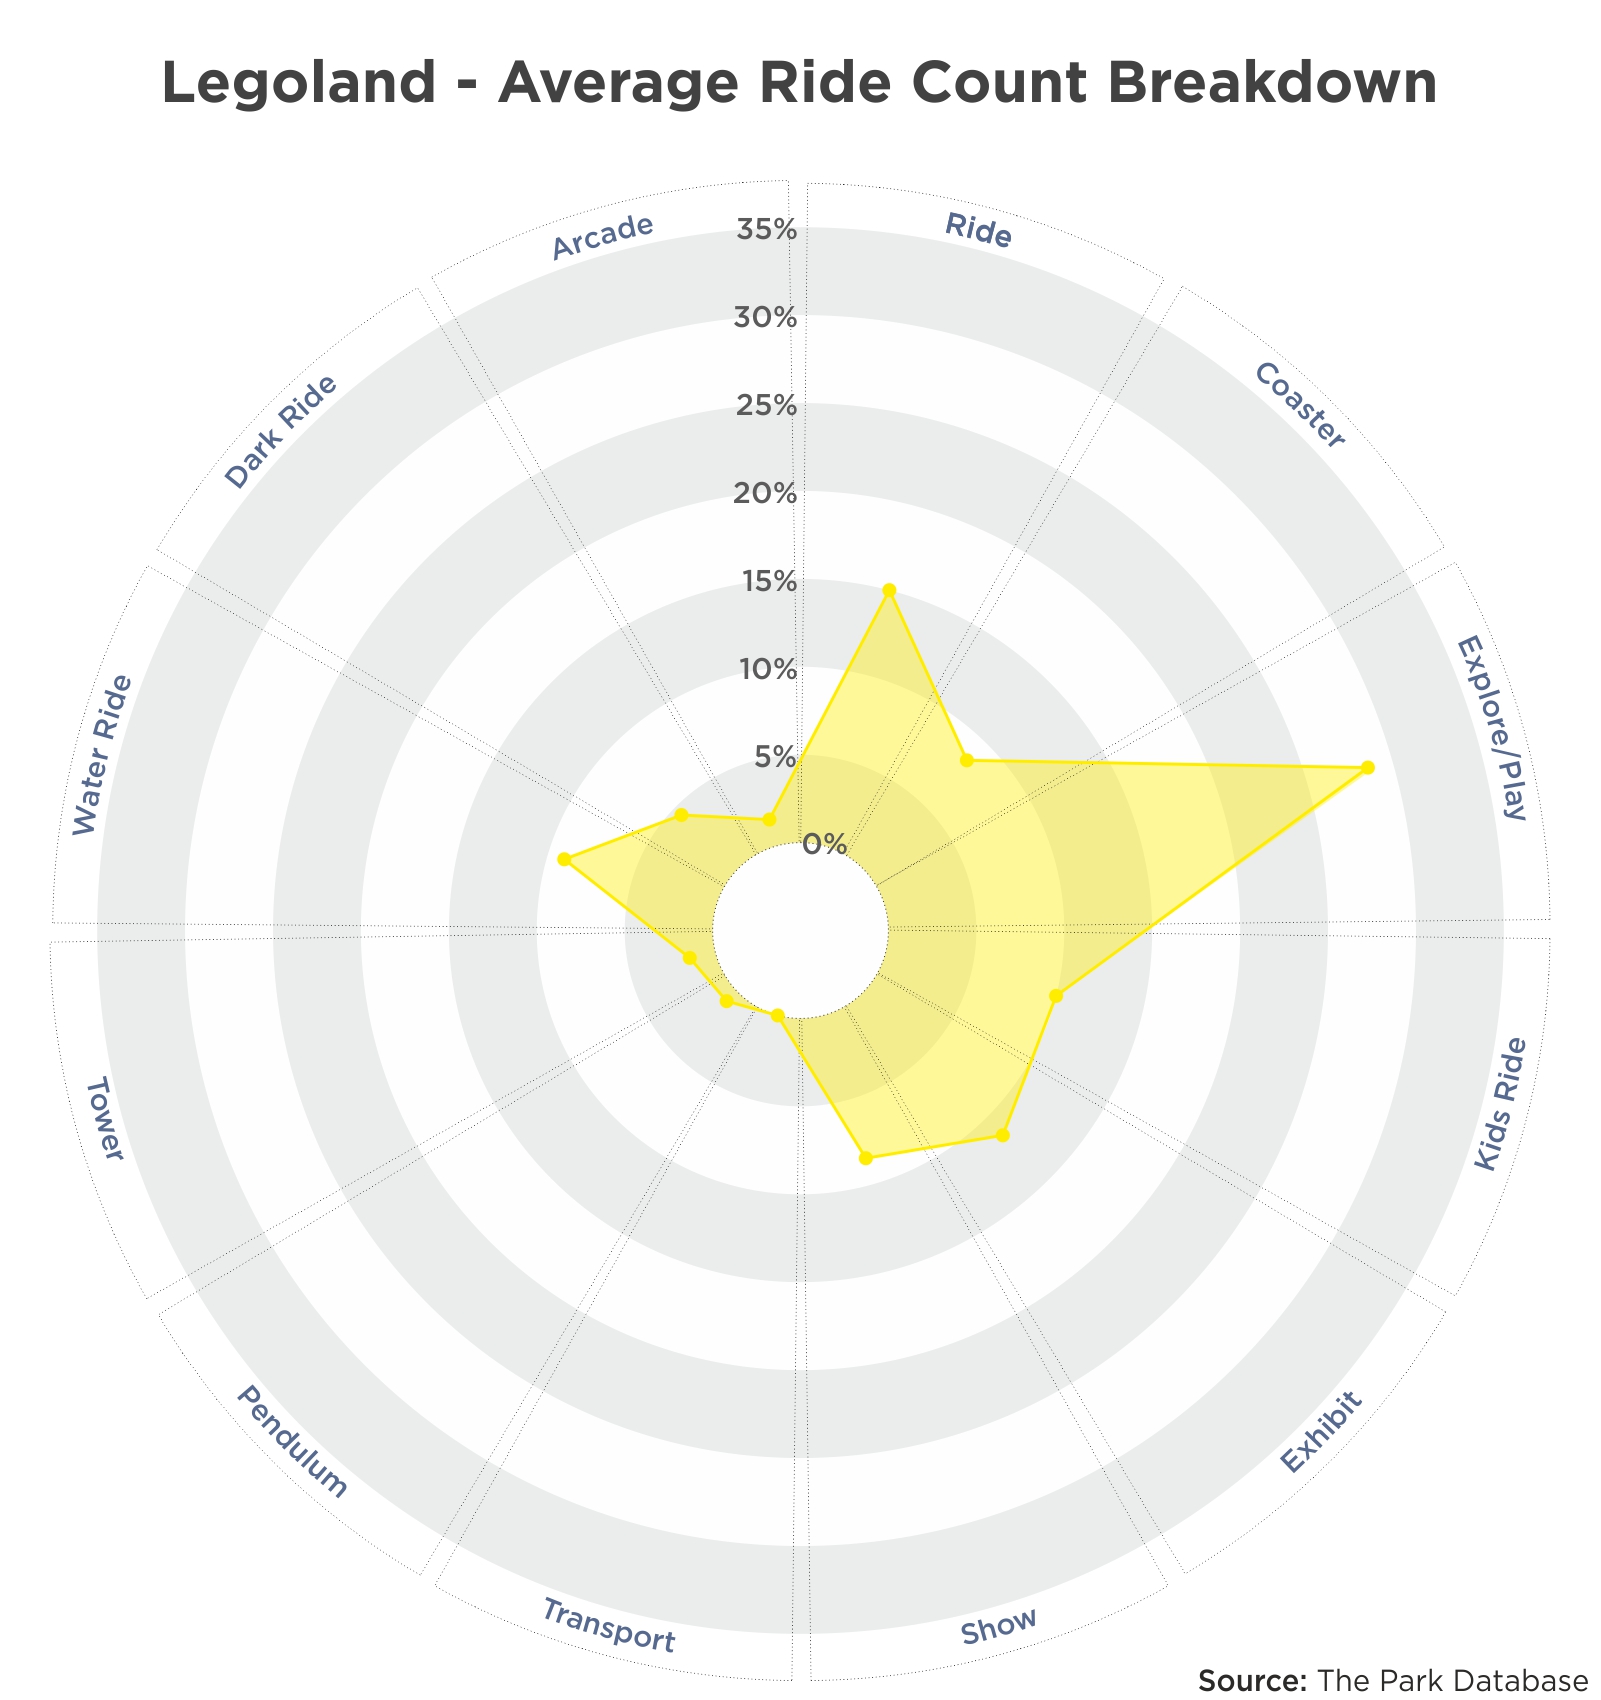
In terms of raw count, explore/play areas comprise nearly 25% of the attraction mix as the single highest category in Legoland parks, but these parks are actually quite balanced, with a mix of exhibits, water rides, coasters, regular rides, all comprising around 10% of the inventory count each.
- In the context of a Legoland park, the largest category of explore/play areas are the various Lego build experiences; i.e., Lego Mindstorms, Lego Academy, Lego Factory, etc. There are also numerous playgrounds themed in the various Lego sets; i.e., pirates, forestmen, adventure, Duplo, city station, etc.
- Exhibits are mostly figures and scenes built of Legos, of course.
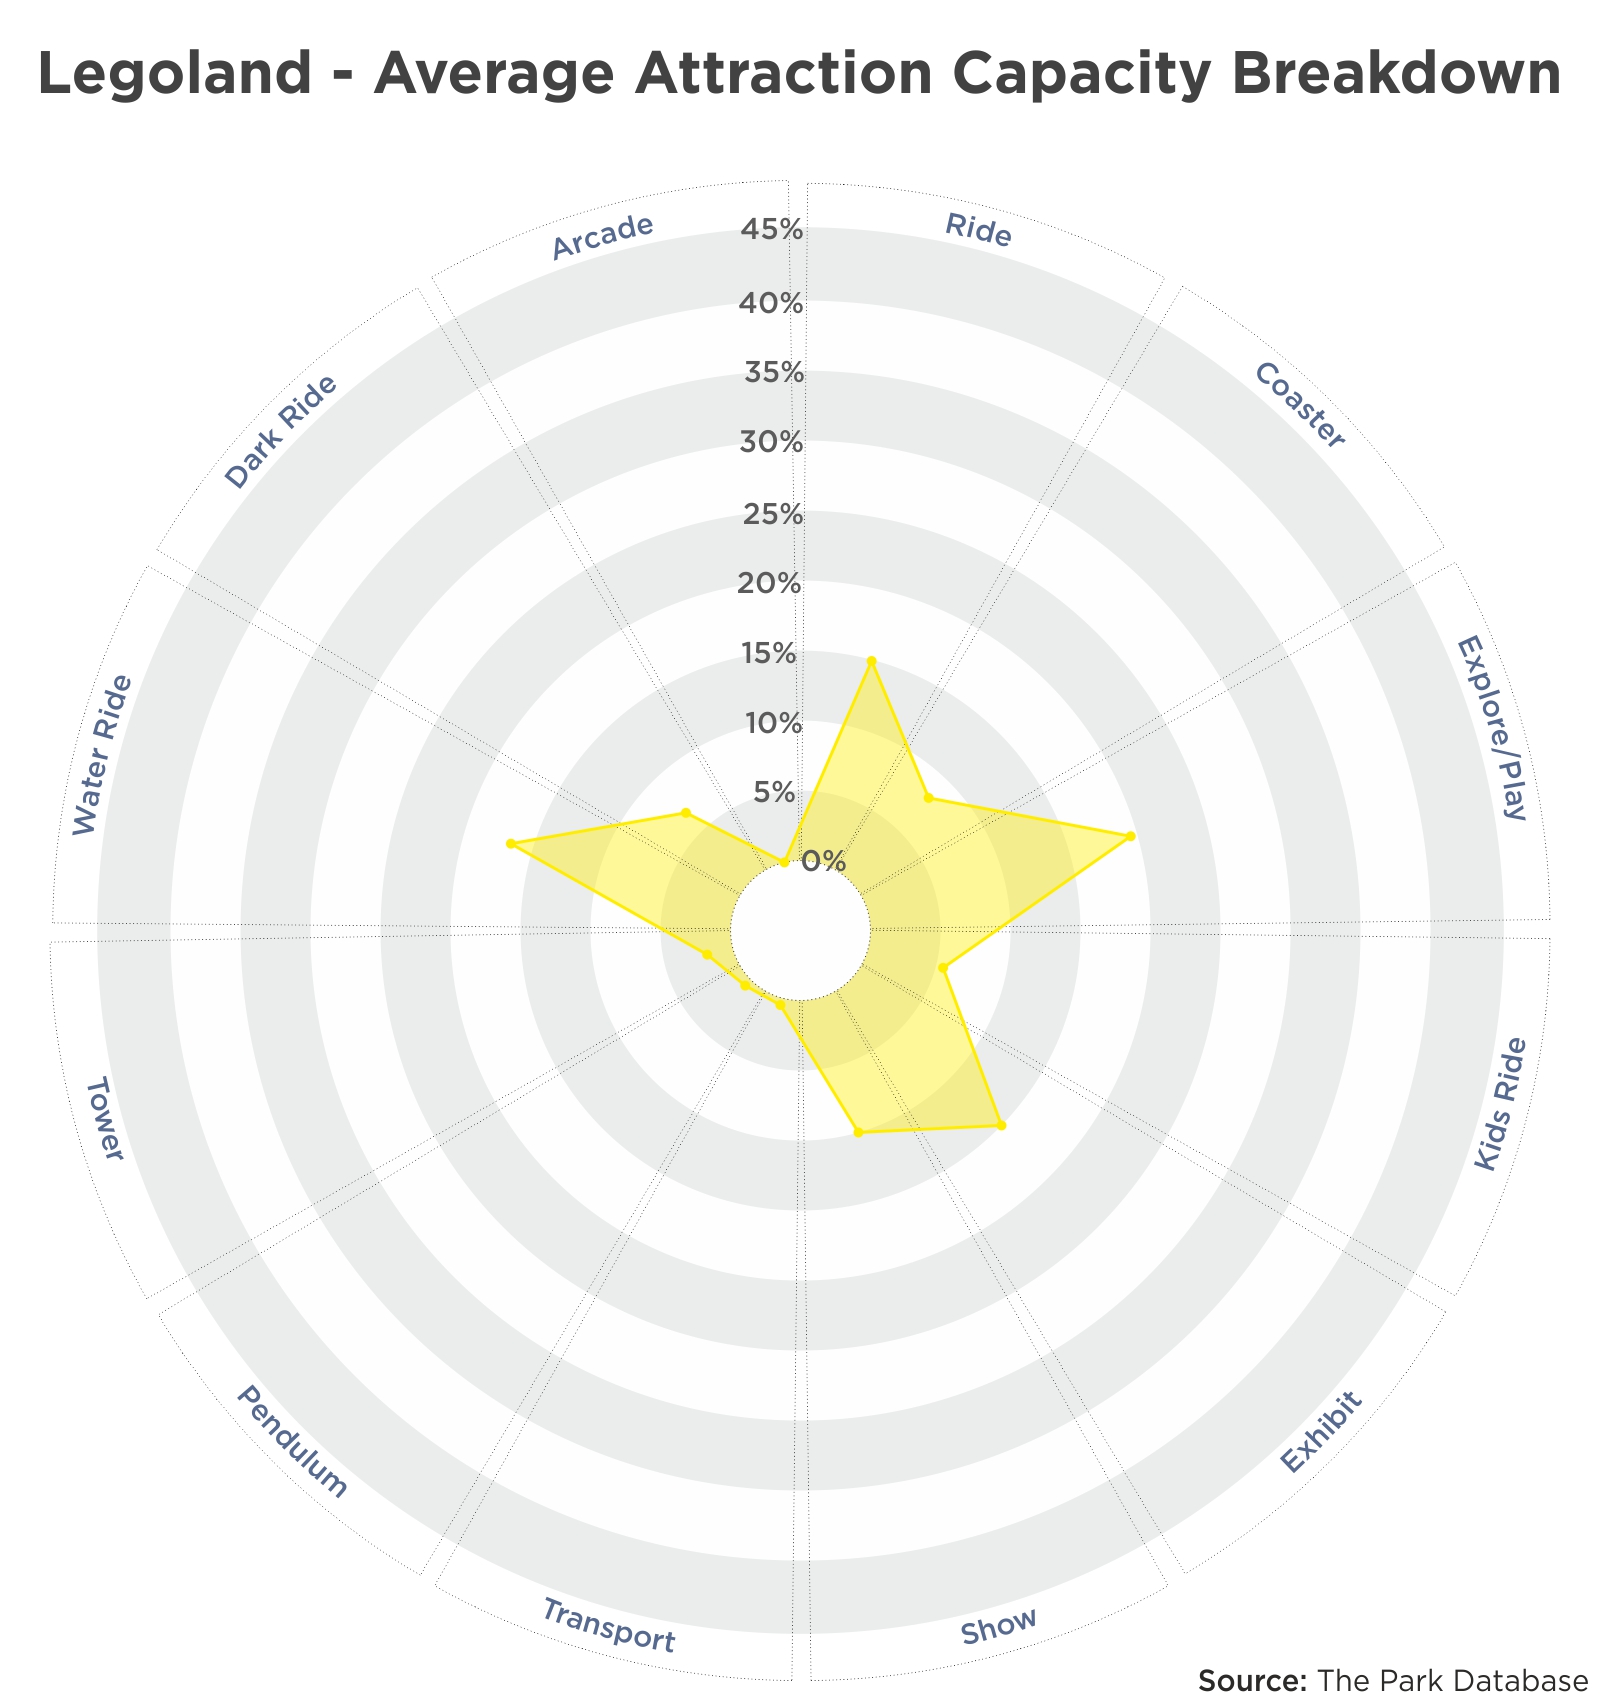
When we look at attraction inventory capacity, the park becomes even more balanced, with no single category over 20%.
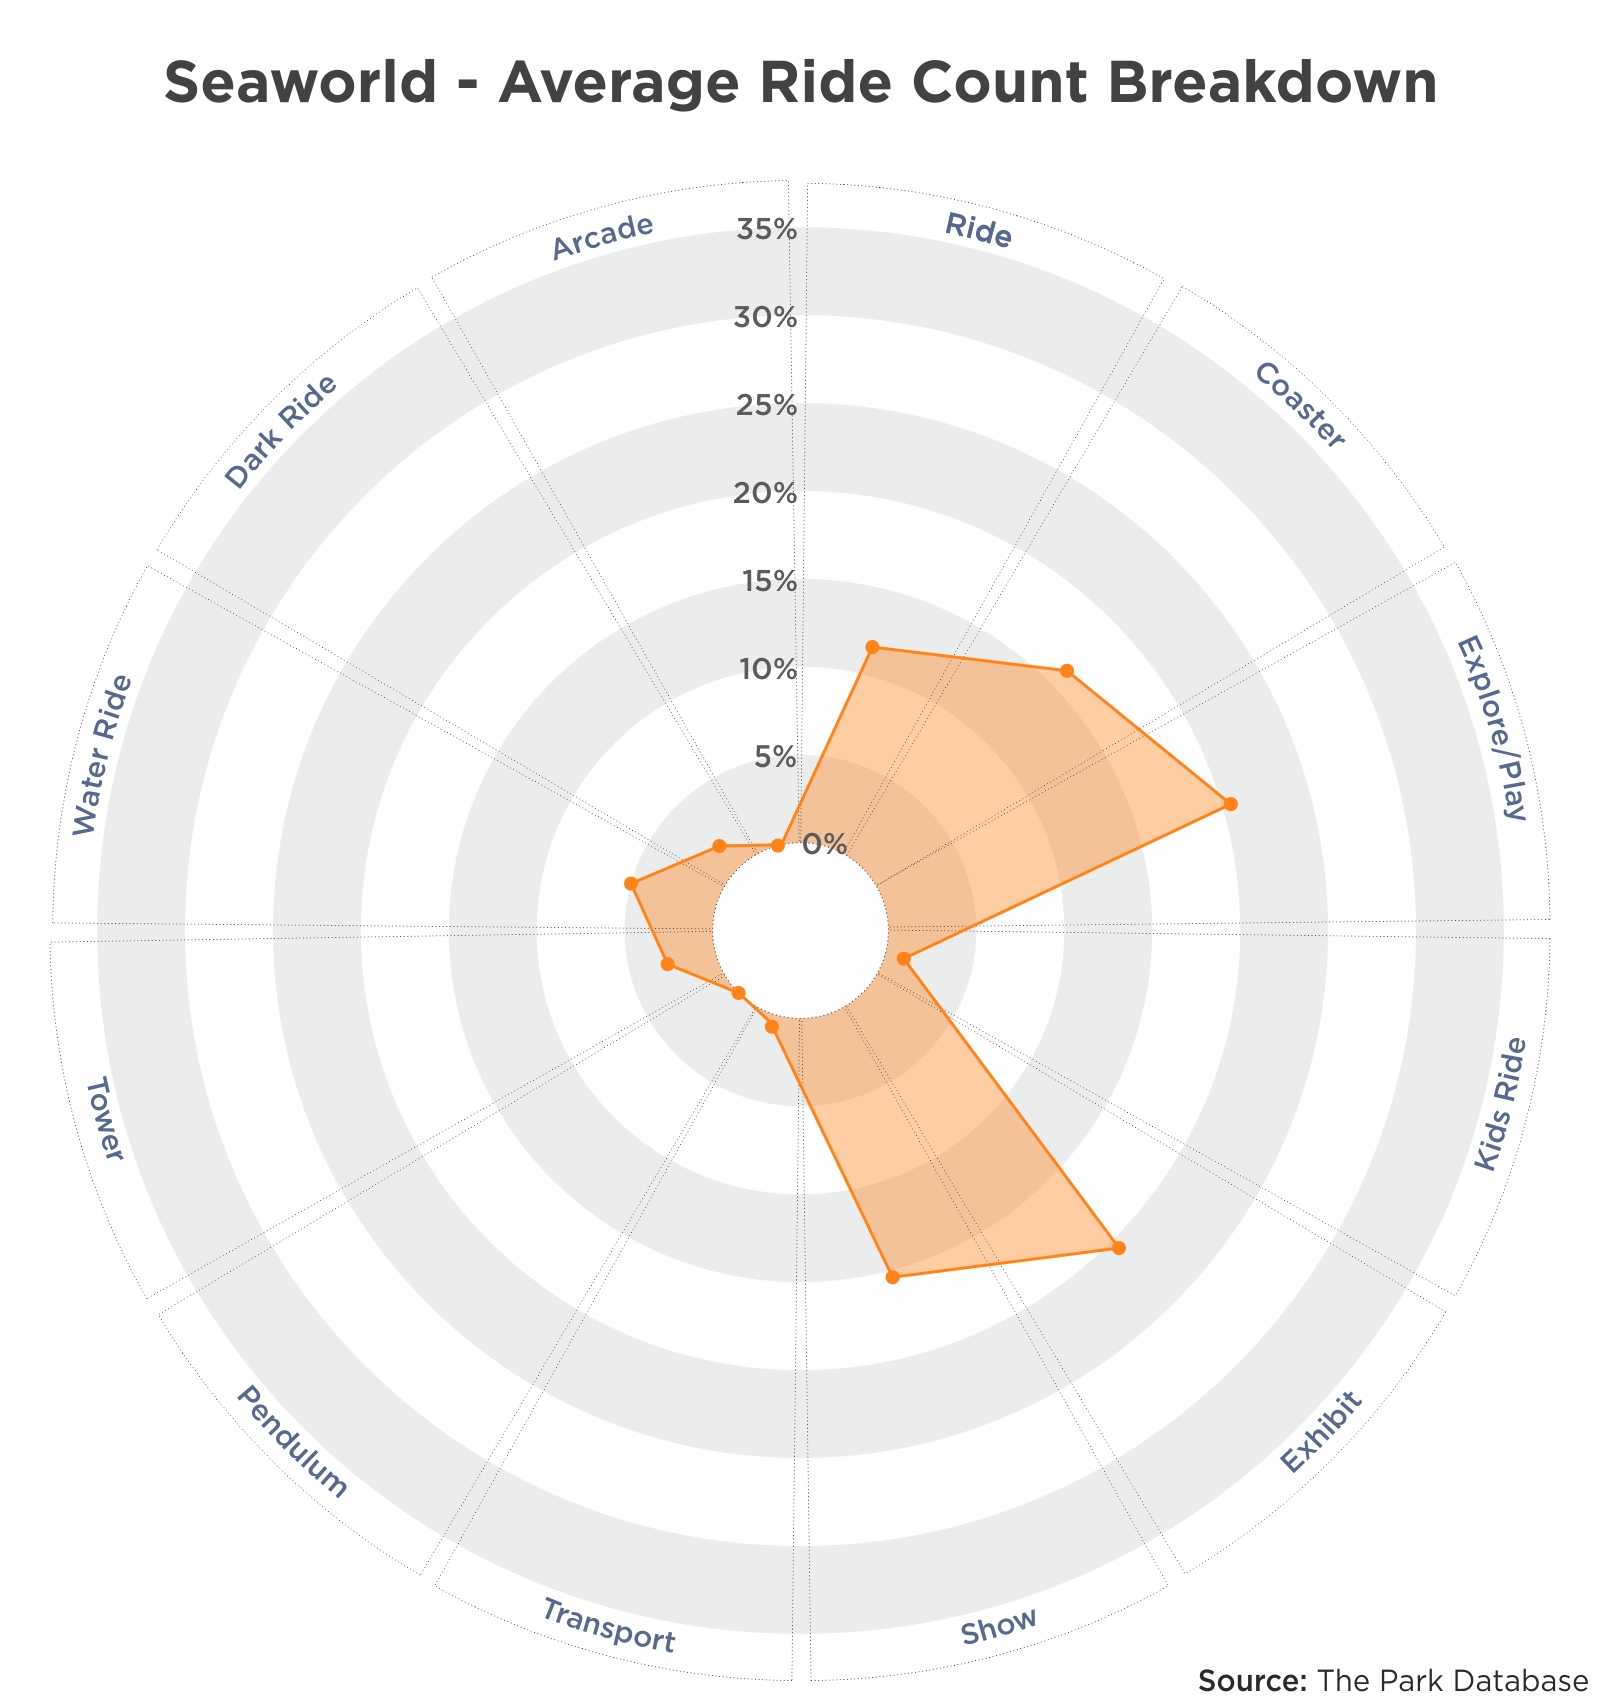
Seaworld – Signature
Seaworld parks – including the Busch Gardens branded attractions – are balanced parks. With wildlife exhibits, explore and play experiences, shows, and a mix of coasters, the parks offer something for everyone, a sentiment that was echoed by a large number of guests on social media.
Wildlife and marine animal exhibits are numerous, as well as explore/play experiences. In the context of the Seaworld parks, the latter are mostly animal interactions, such as safaris and marine animal interactions with penguins, dolphins, belugas, and so on. These are mostly upcharge (separately charged) experiences.
Because of the lower capacity nature of these explore areas as well as animal exhibits, the overall capacity for these attractions diminishes somewhat in the capacity calculation. Nevertheless, the Seaworld parks are – contrary to the perception of many – quite balanced in attraction content. 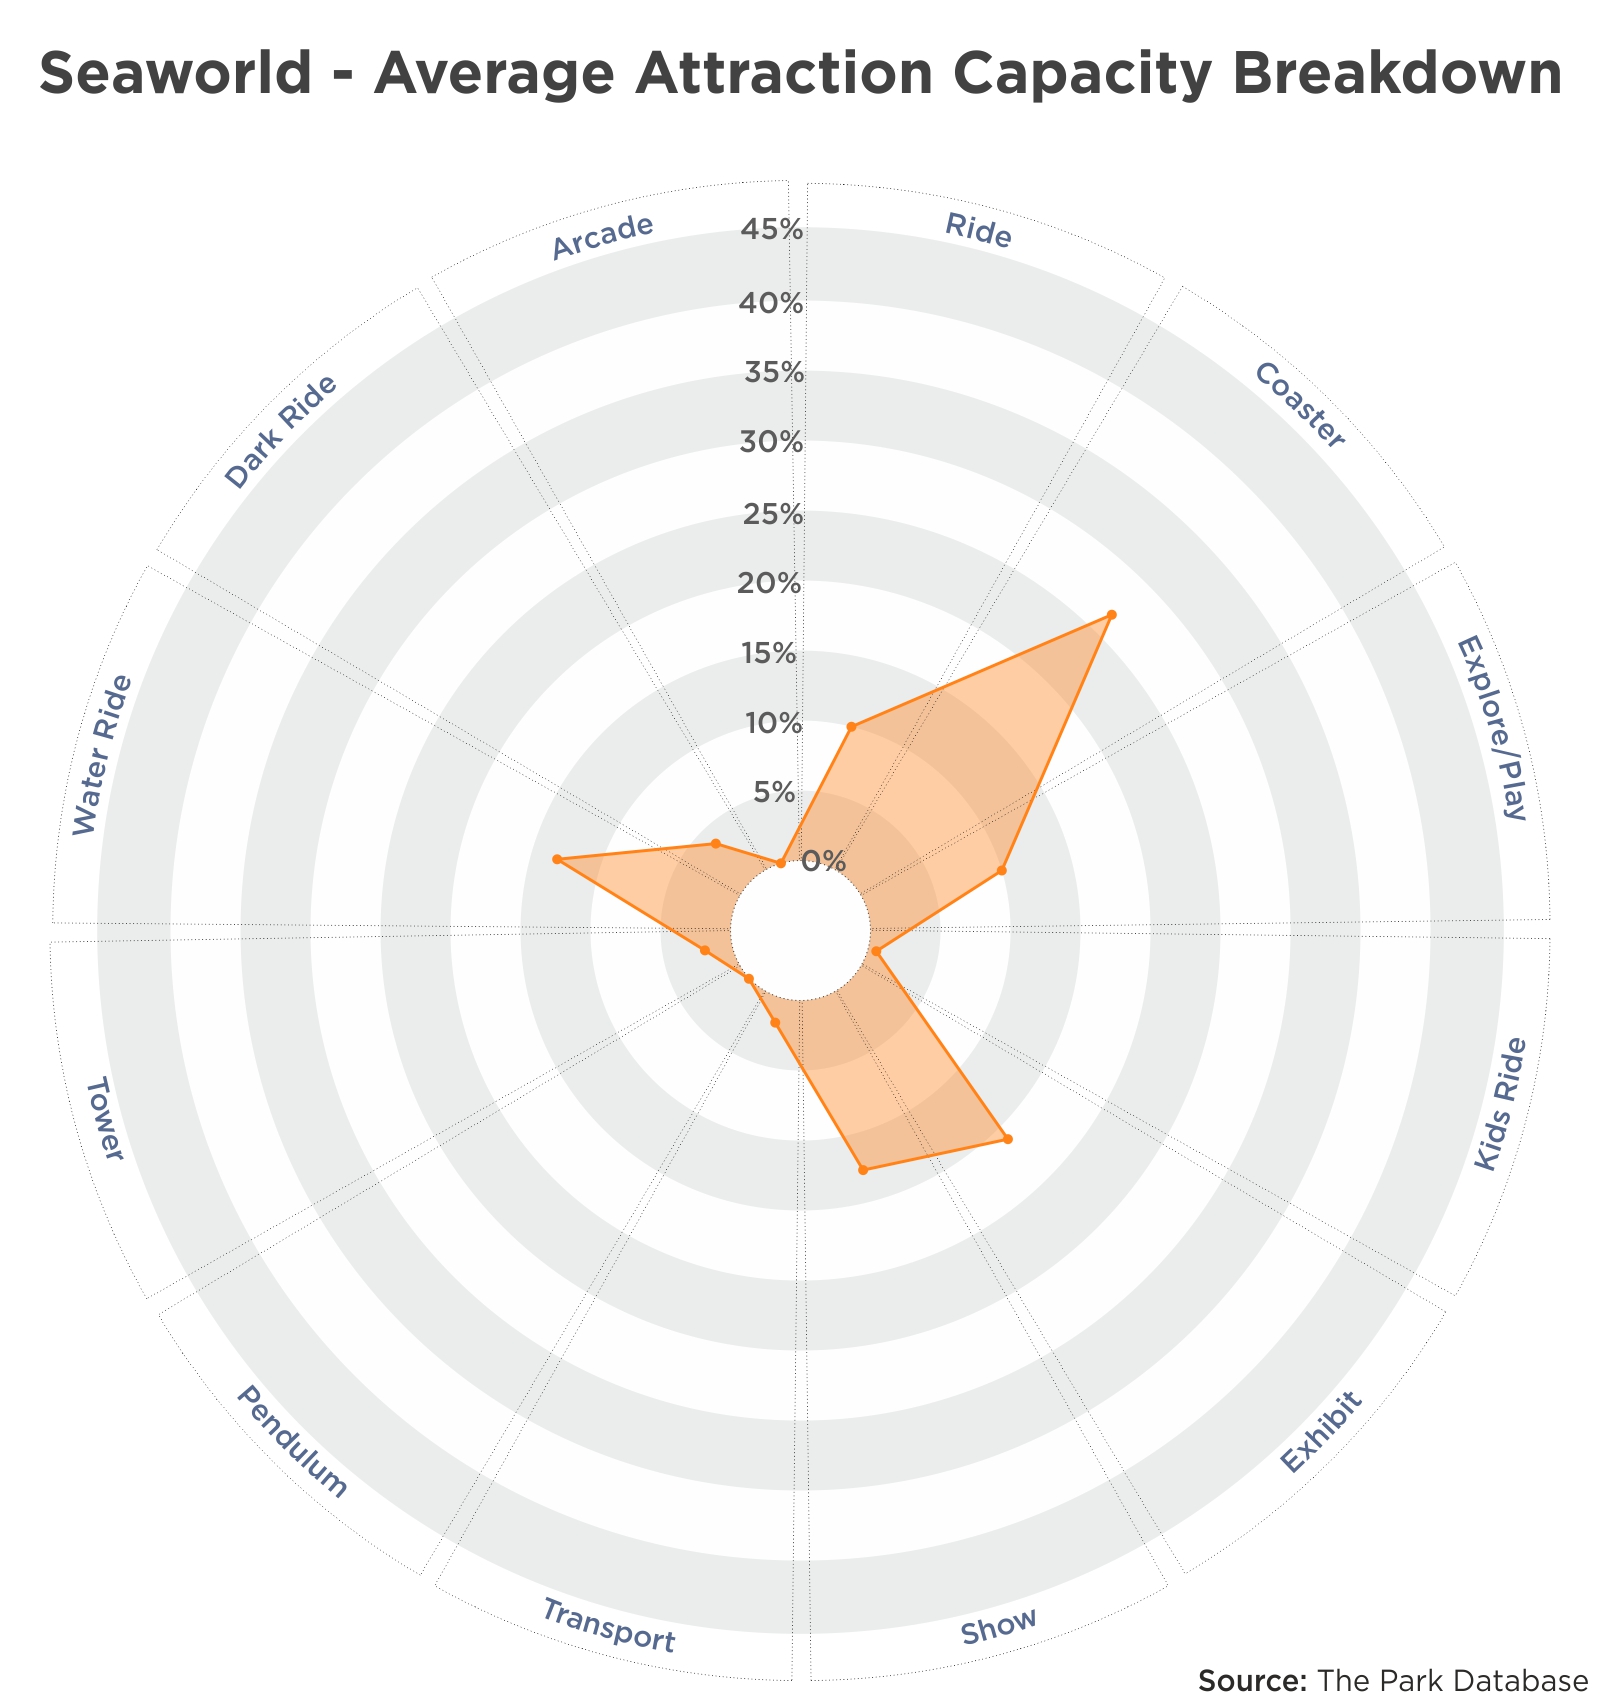
Guest Experience
Now let’s move onto what people are actually saying about the parks. For this, we looked at social media. In contrast to surveys or focus groups, we find social media to be a better proxy to gauge customer perception and sentiments, as responses and reviews are usually both immediate and unfiltered.
For these reviews, our sources were Facebook, Tripadvisor, and Twitter, and we targeted at least 100 reviews per brand.
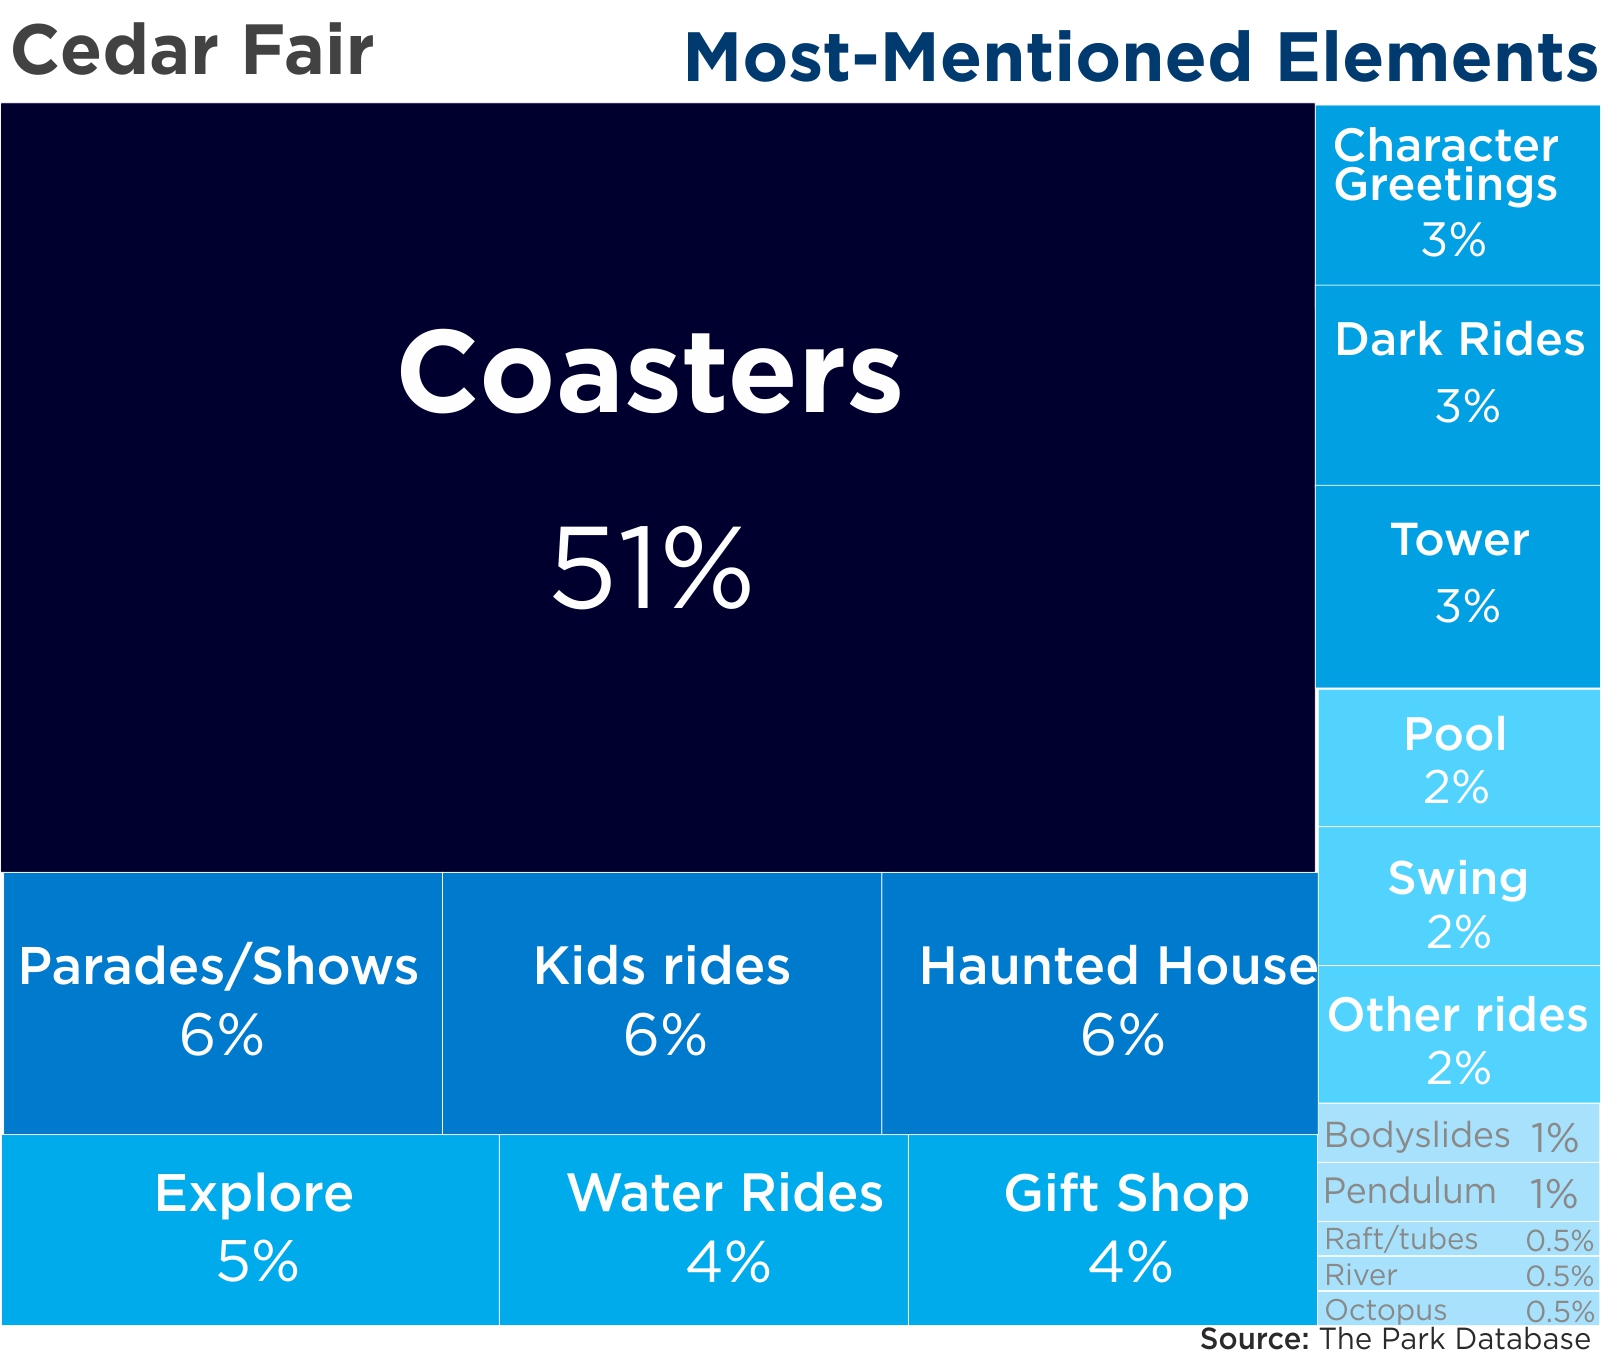
Cedar Fair – Social Media
Most-mentioned: As might be expected, coasters are the main attraction at Cedar Fair parks, above any other type of ride. Even though these are less than 50% of the actual attraction inventory, these are above and away, the main event in public perception.
Favorable mentions: there were some comments about the lack of entertainment and attraction diversity; however, on the whole, the best thing about the park is its entertainment value.
Interestingly, discounts were also mentioned in some volume. These comments related to the ability to receive online and package discounts.
Service is a category that received mixed reviews. The number of favorable reviews in this category was equaled by complaints about insufficient staff, rude behavior, and lack of training.
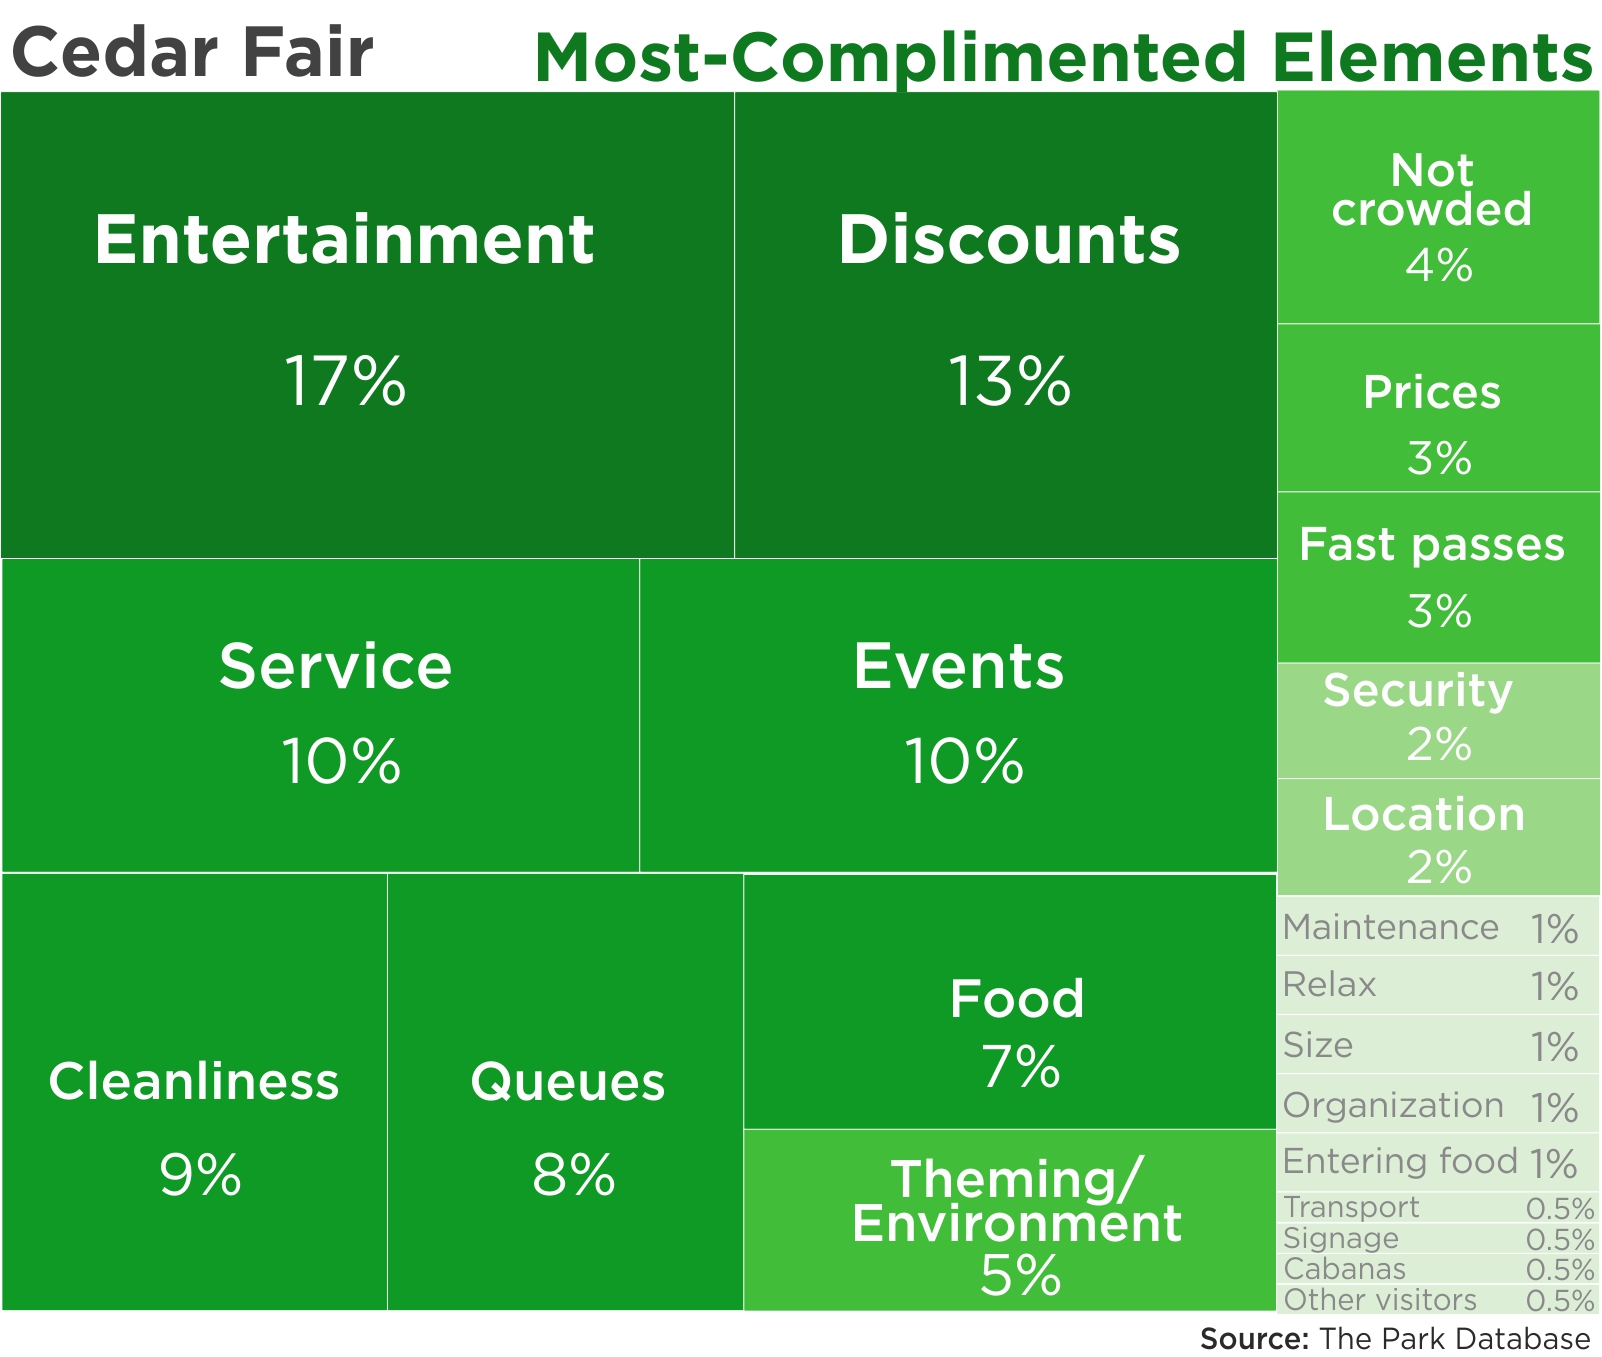
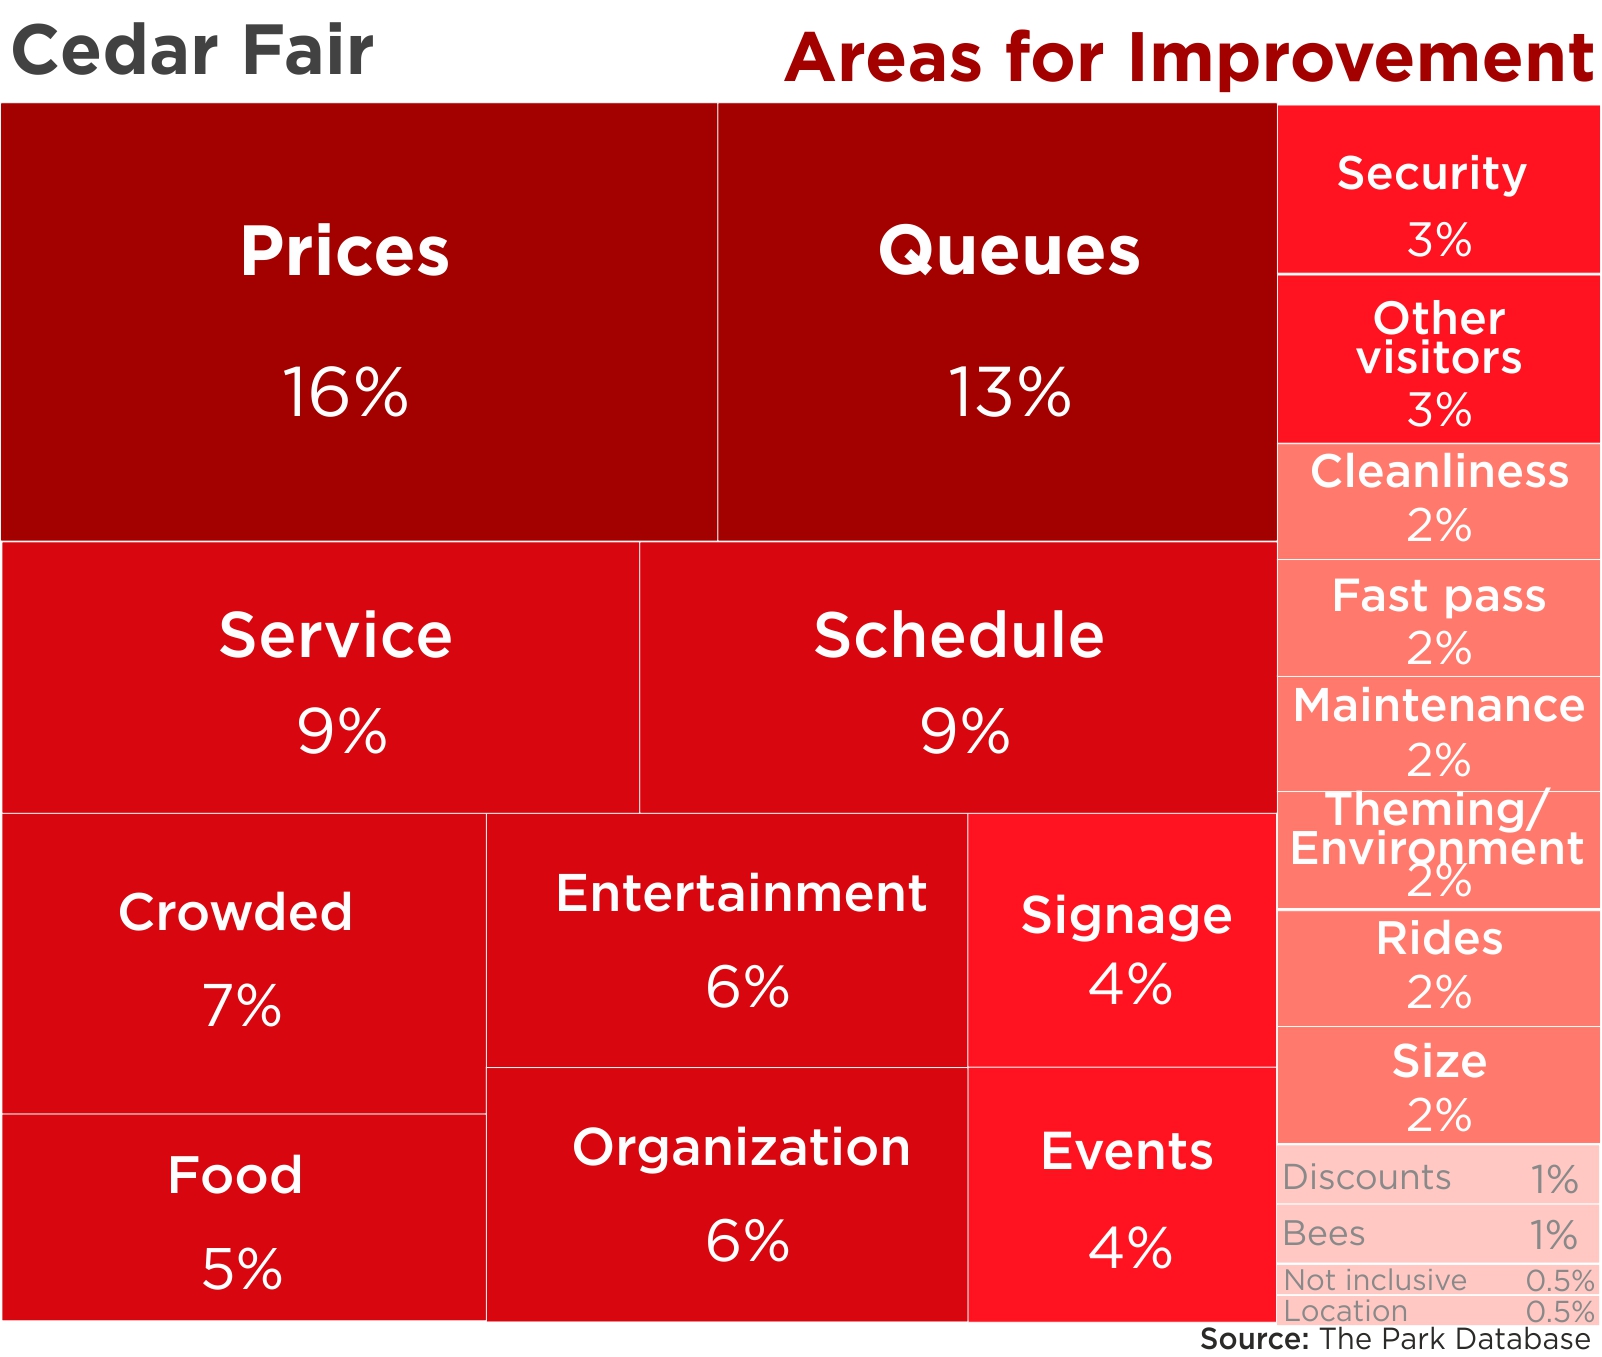
Areas for Improvement: while tickets were often mentioned as being too expensive, the more mentioned category was expensive food and beverage, which seemed to be the worst thing about Cedar Fair parks, at least on social media.
While queues were mentioned as a complaint, the number of favorable mentions in this category cannot be ignored – in fact, this was mentioned in equal measure both favorably and negatively. Many guests praised the fact that the parks were not crowded during certain times of the year, and planned their trips around this point.
Six Flags – Social Media
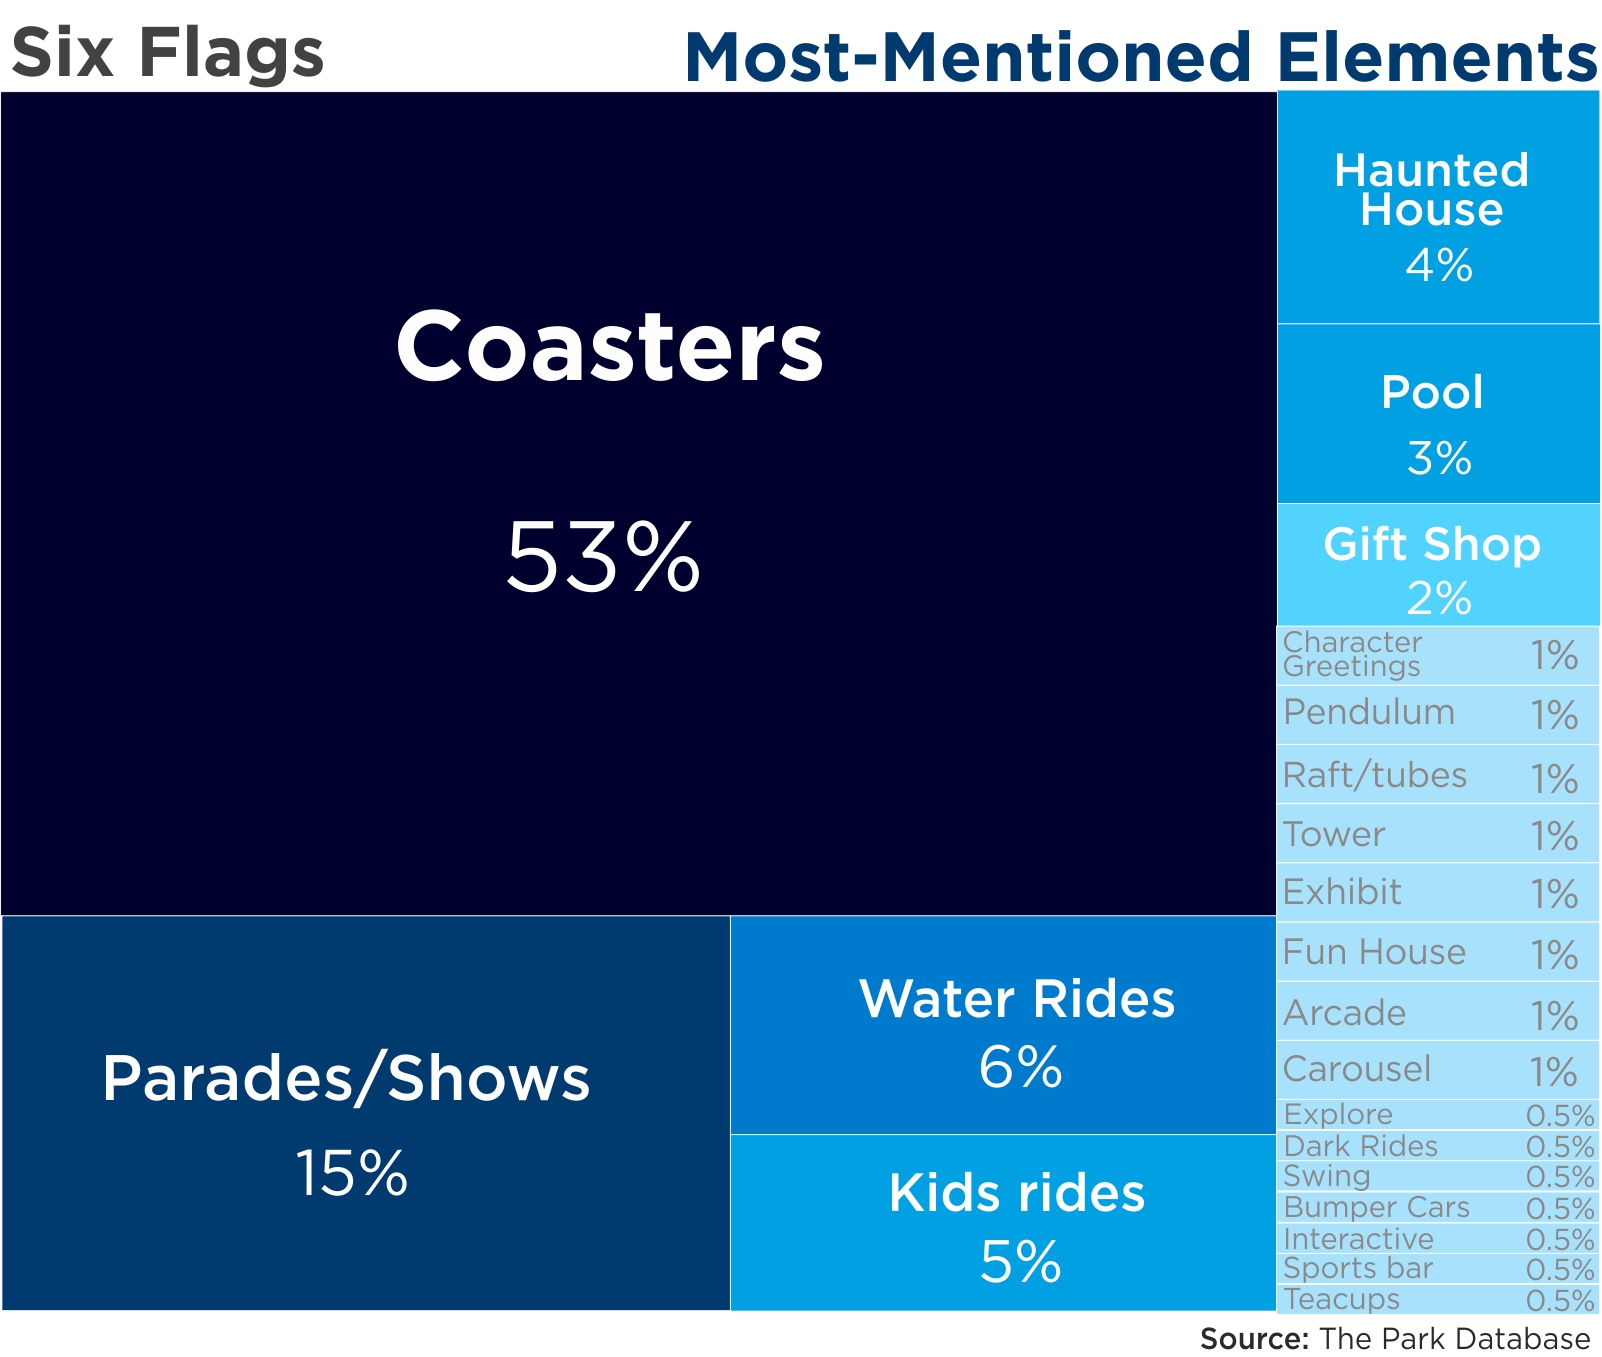
Most mentioned: Similar to Cedar Fair, coasters are the main attraction here, with numerous mentions of Superman, Batman, Joker, Boomerang, and Goliath. Many coasters at Six Flags have entered the pantheon of classics, and many guests praised the fact that old coasters were still operating. These are by far the most-mentioned, and among the best things to do at Six Flags.
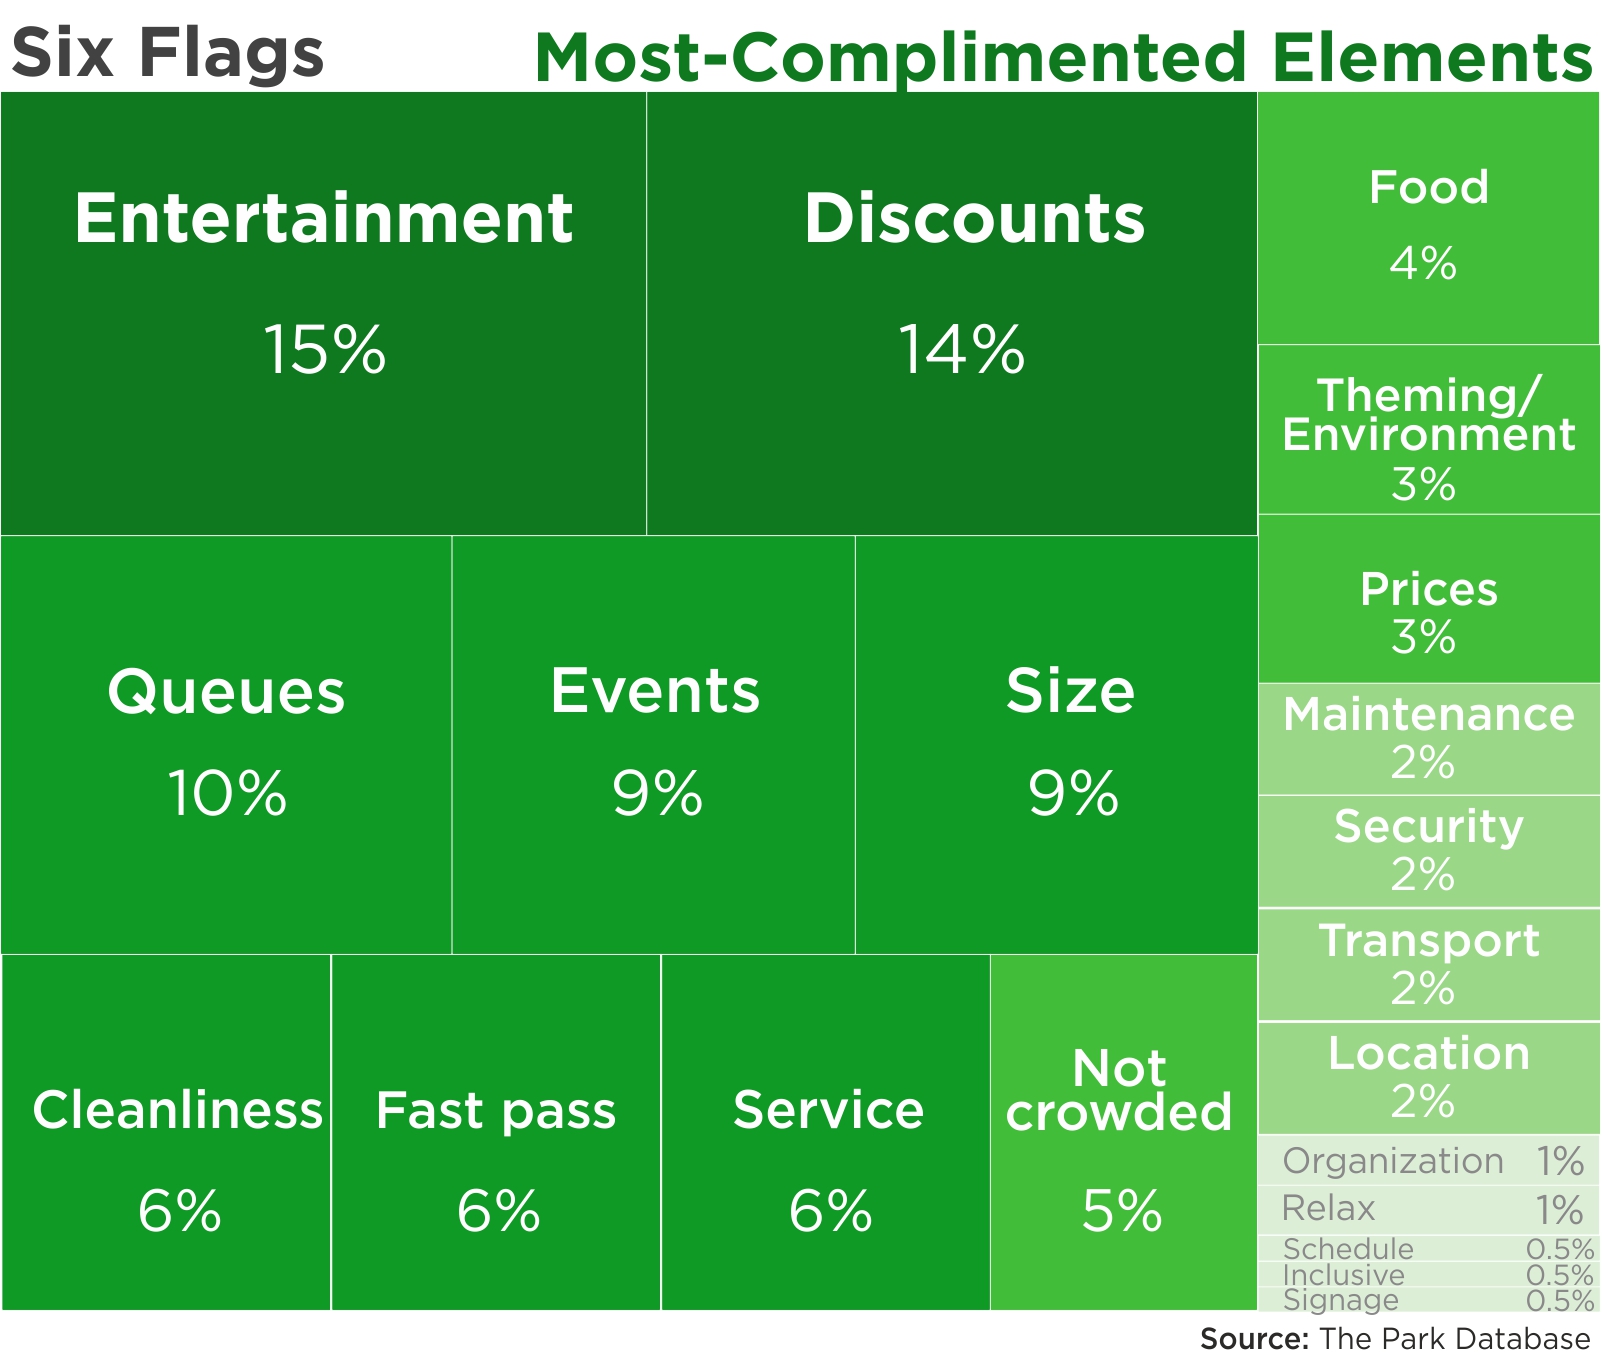
Favorable mentions: the guest experience is similar, though not the same, as at Cedar Fair. Both ‘entertaining’ and ‘discounts’ earned top spots in favorable mentions, although one of the best things about Six Flags was is also its annual passes. Conversely, there were some complaints about the emphasis on high thrill rides.
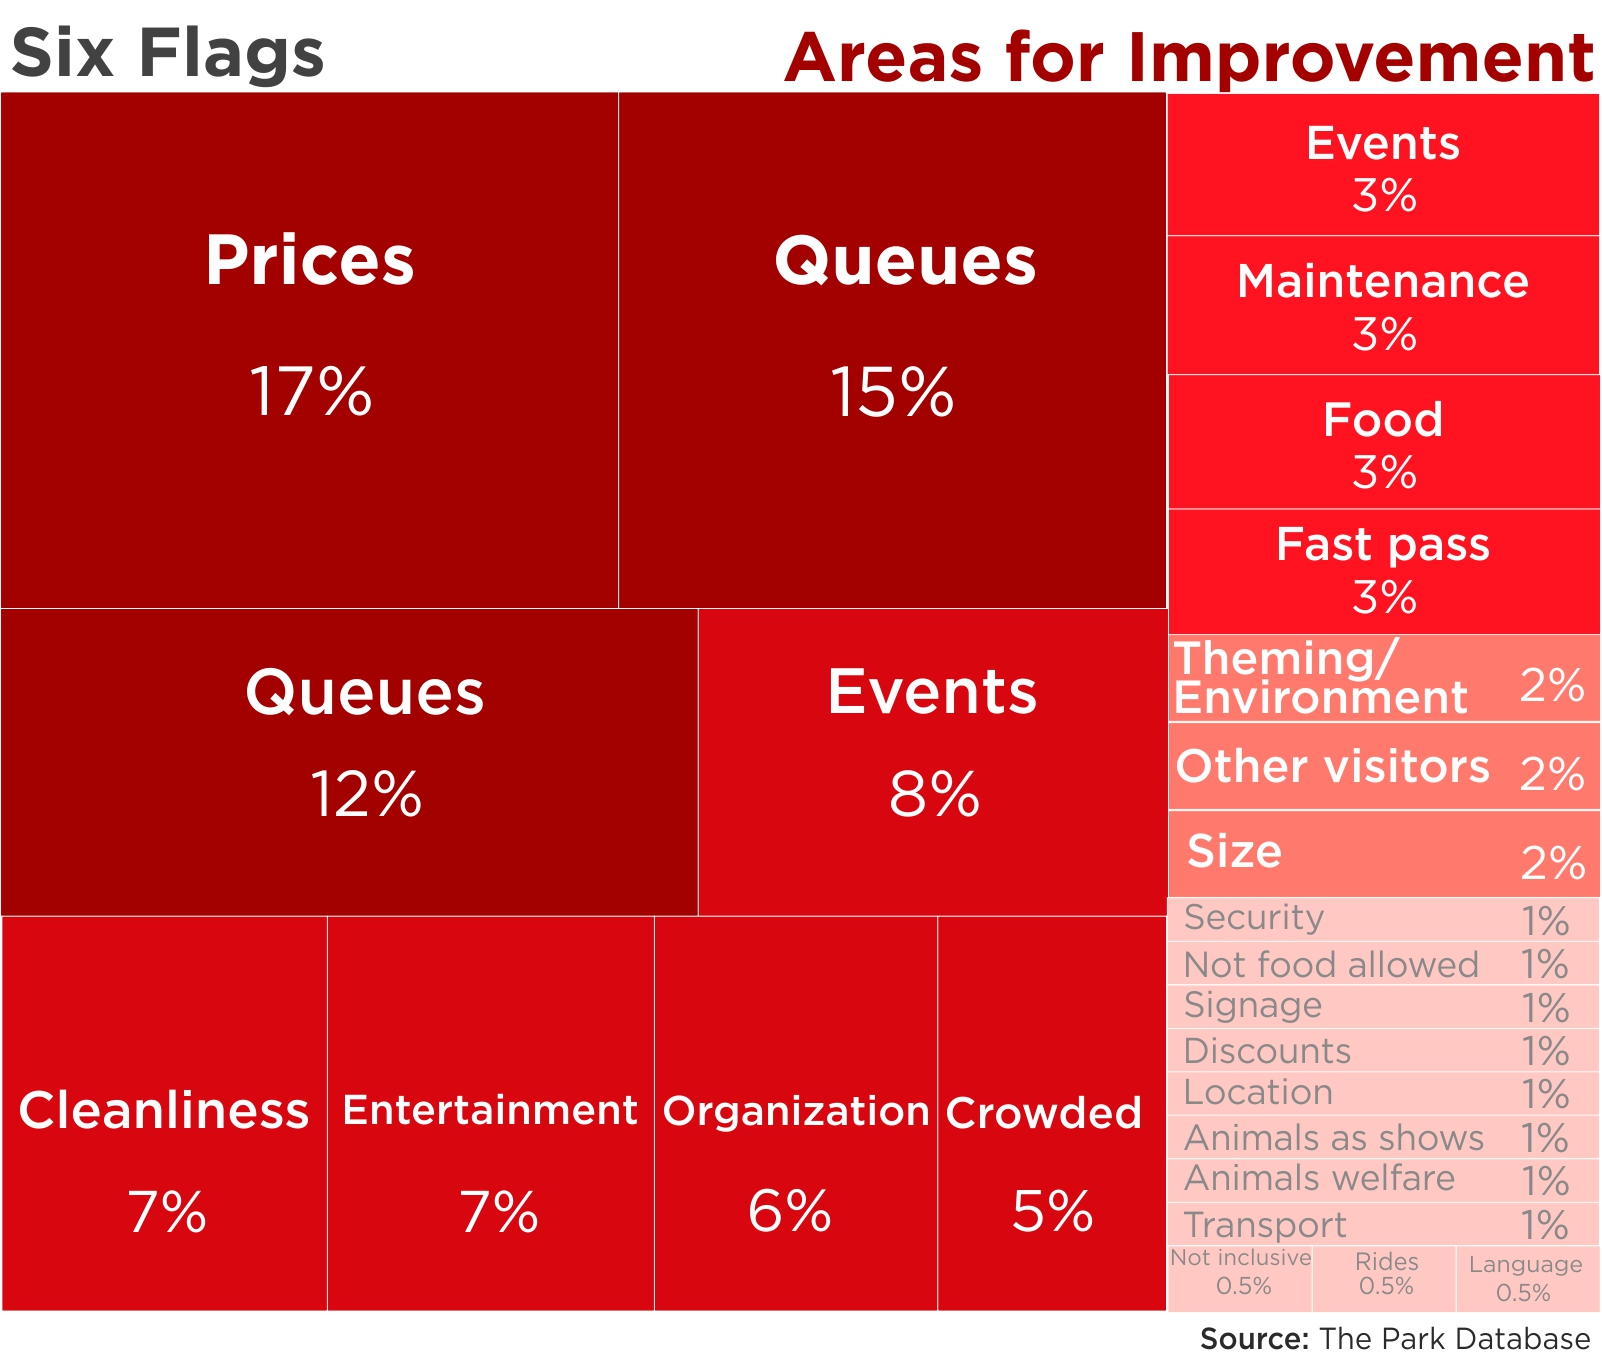
Areas for improvement: Prices for both entry tickets and parking were consistently mentioned. Scheduling conflicts received a prominent 3rd position at Six Flags, with mentions of attractions closed due to maintenance and understaffing. These were among the worst things in the Six Flags experience.
Disney – Social Media
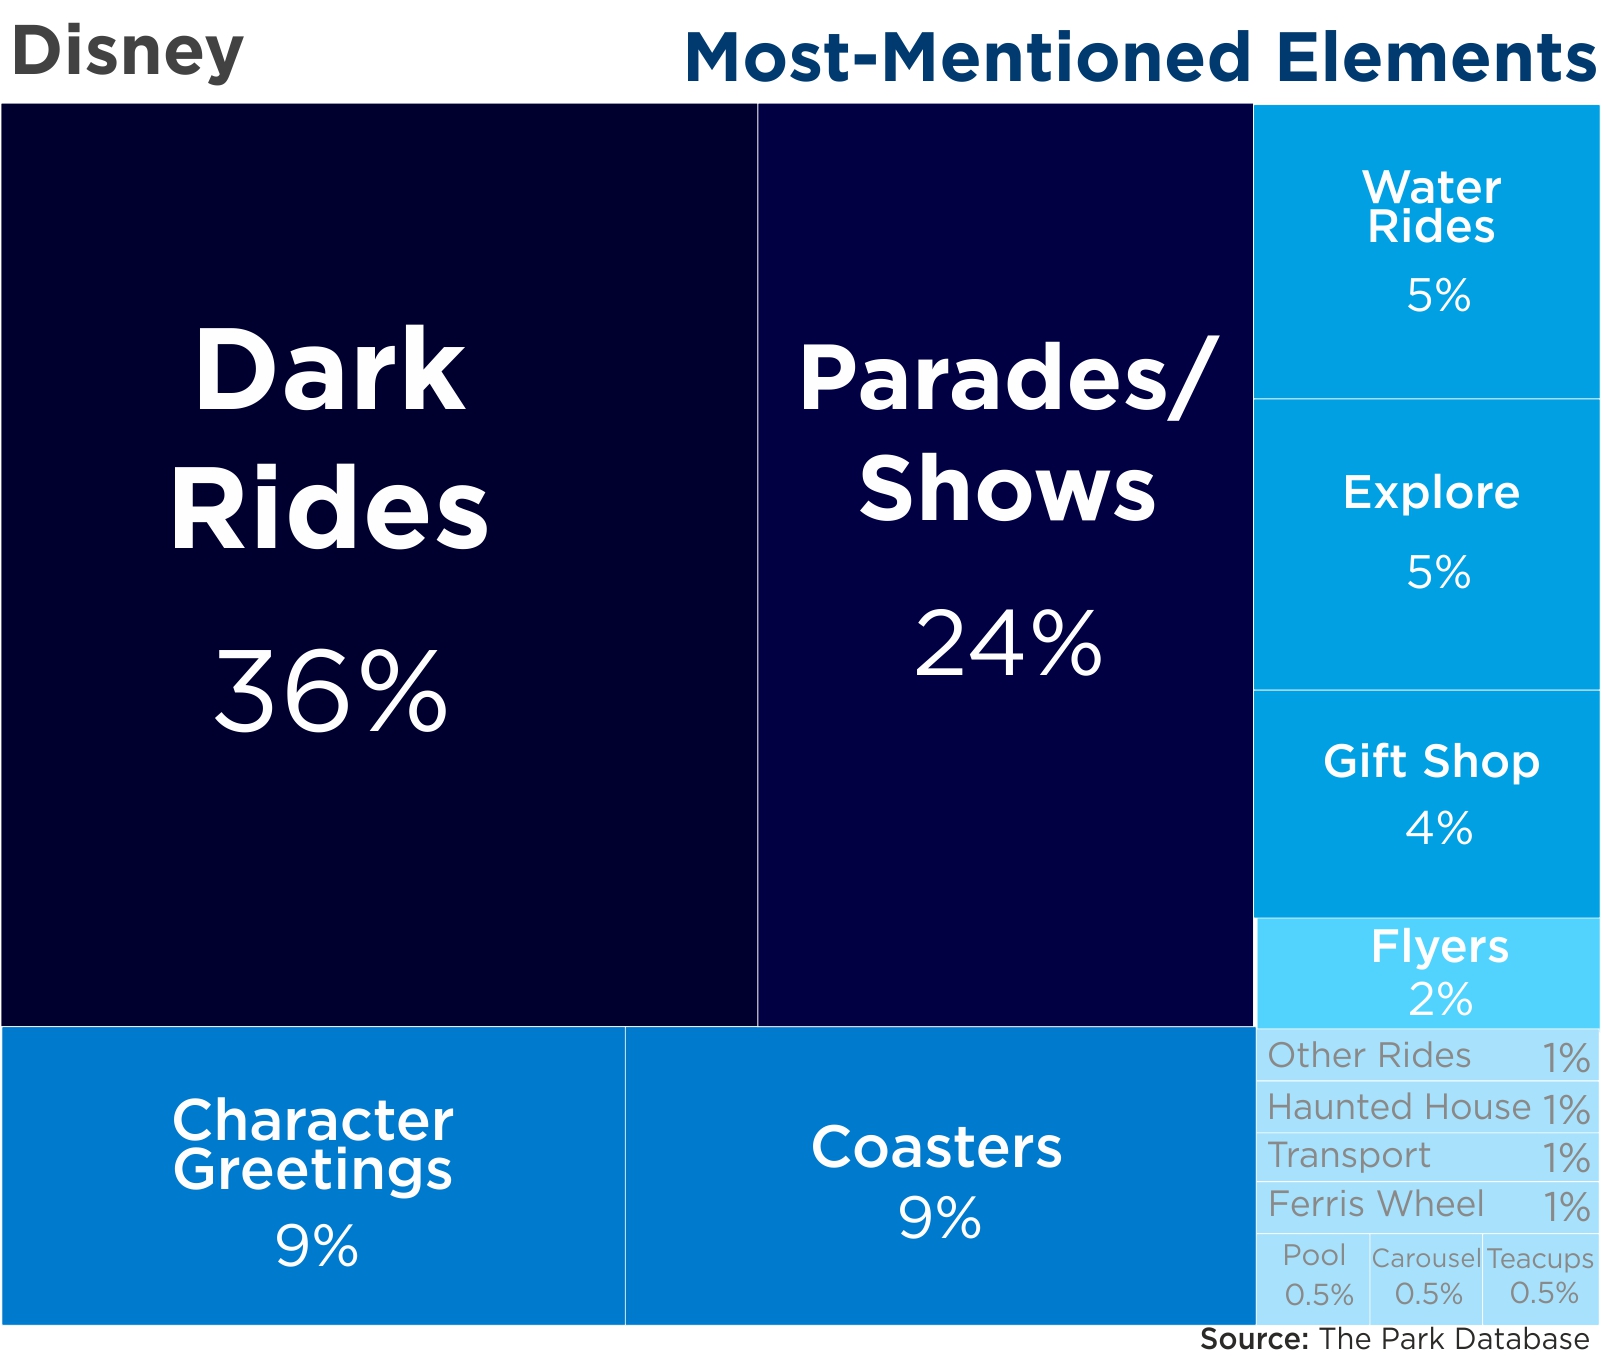
Most mentioned: the dark rides and the parades/shows, in almost a mirror image of the attraction signature mentioned above.
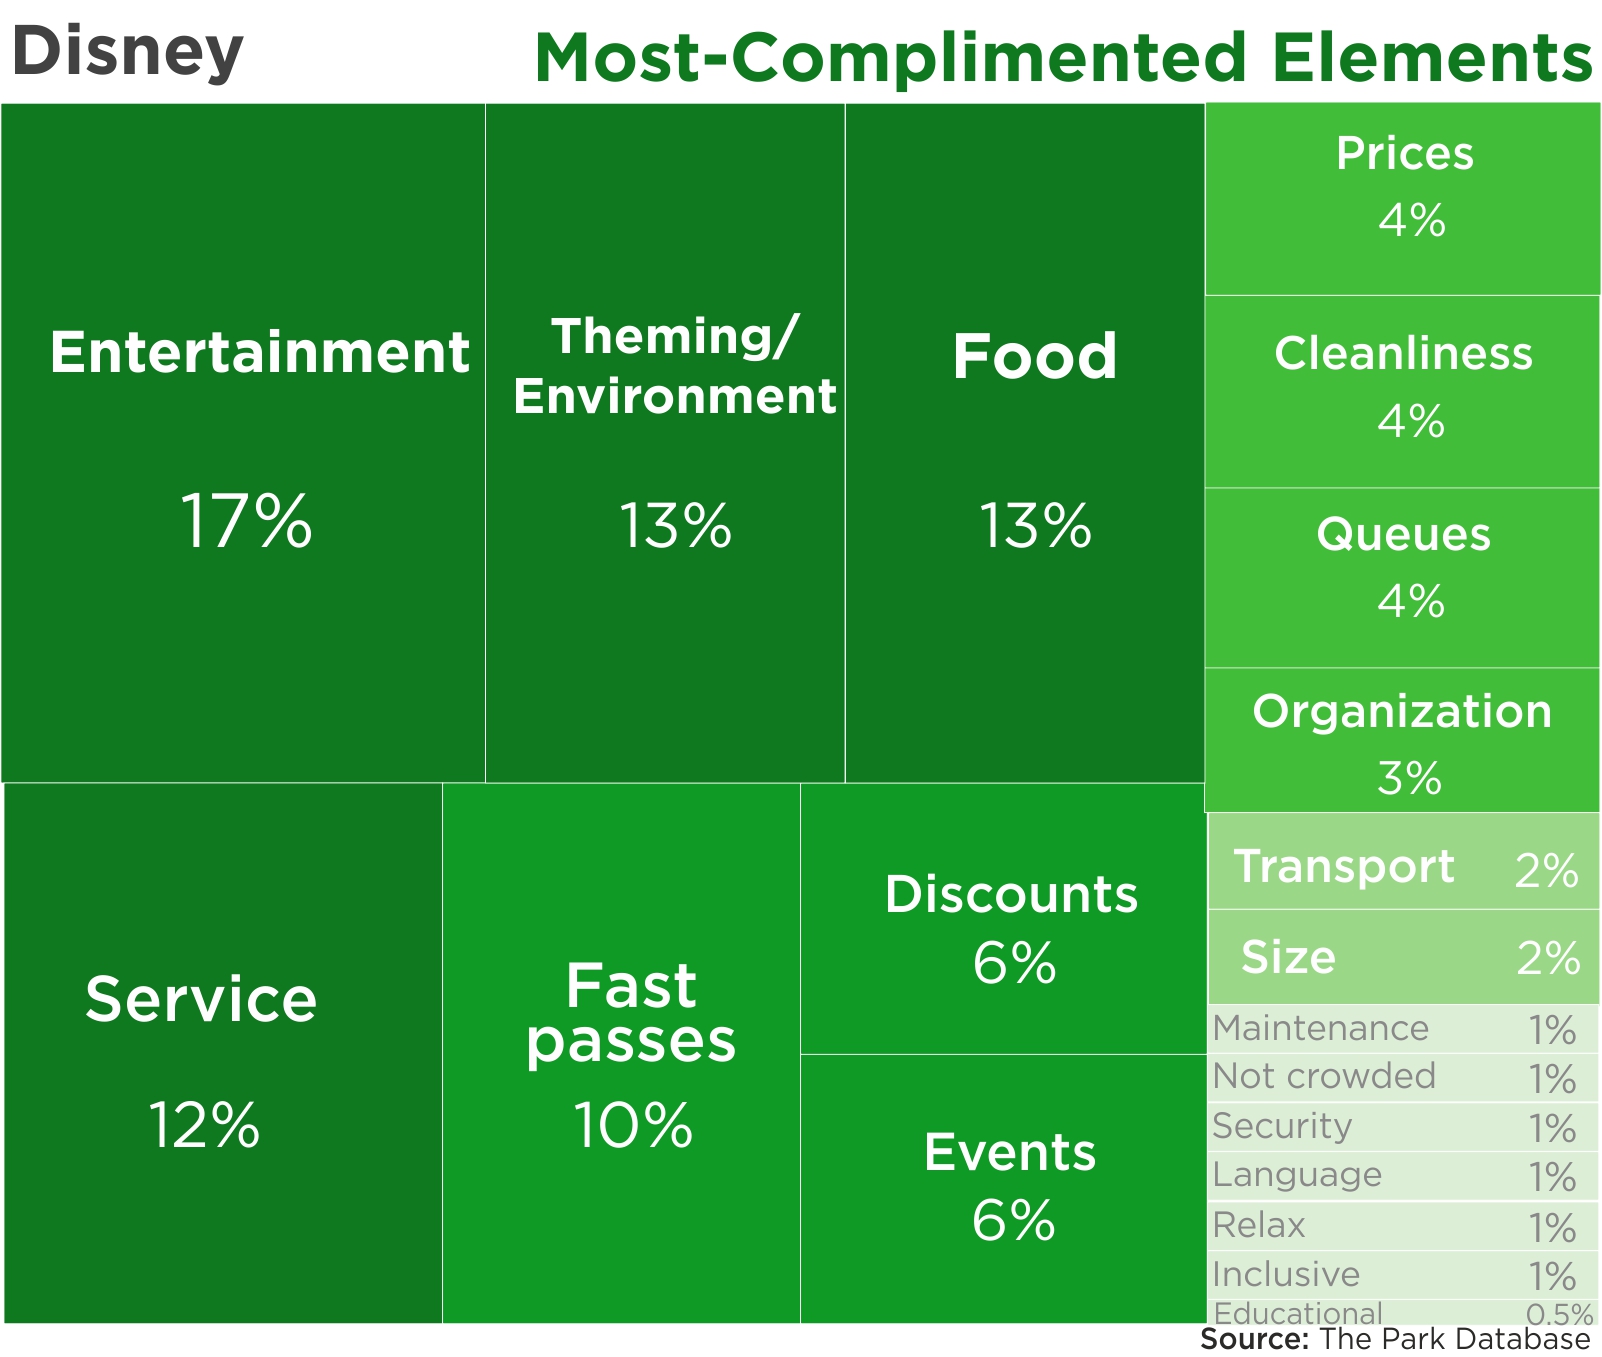
Favorable mentions: the best things about a Disney park are their theming, environmental design, and the overall well-kempt landscaping. The high quality of food, service, and functionality of fast passes were all top mentions. Discounts were only a top 6 mention.
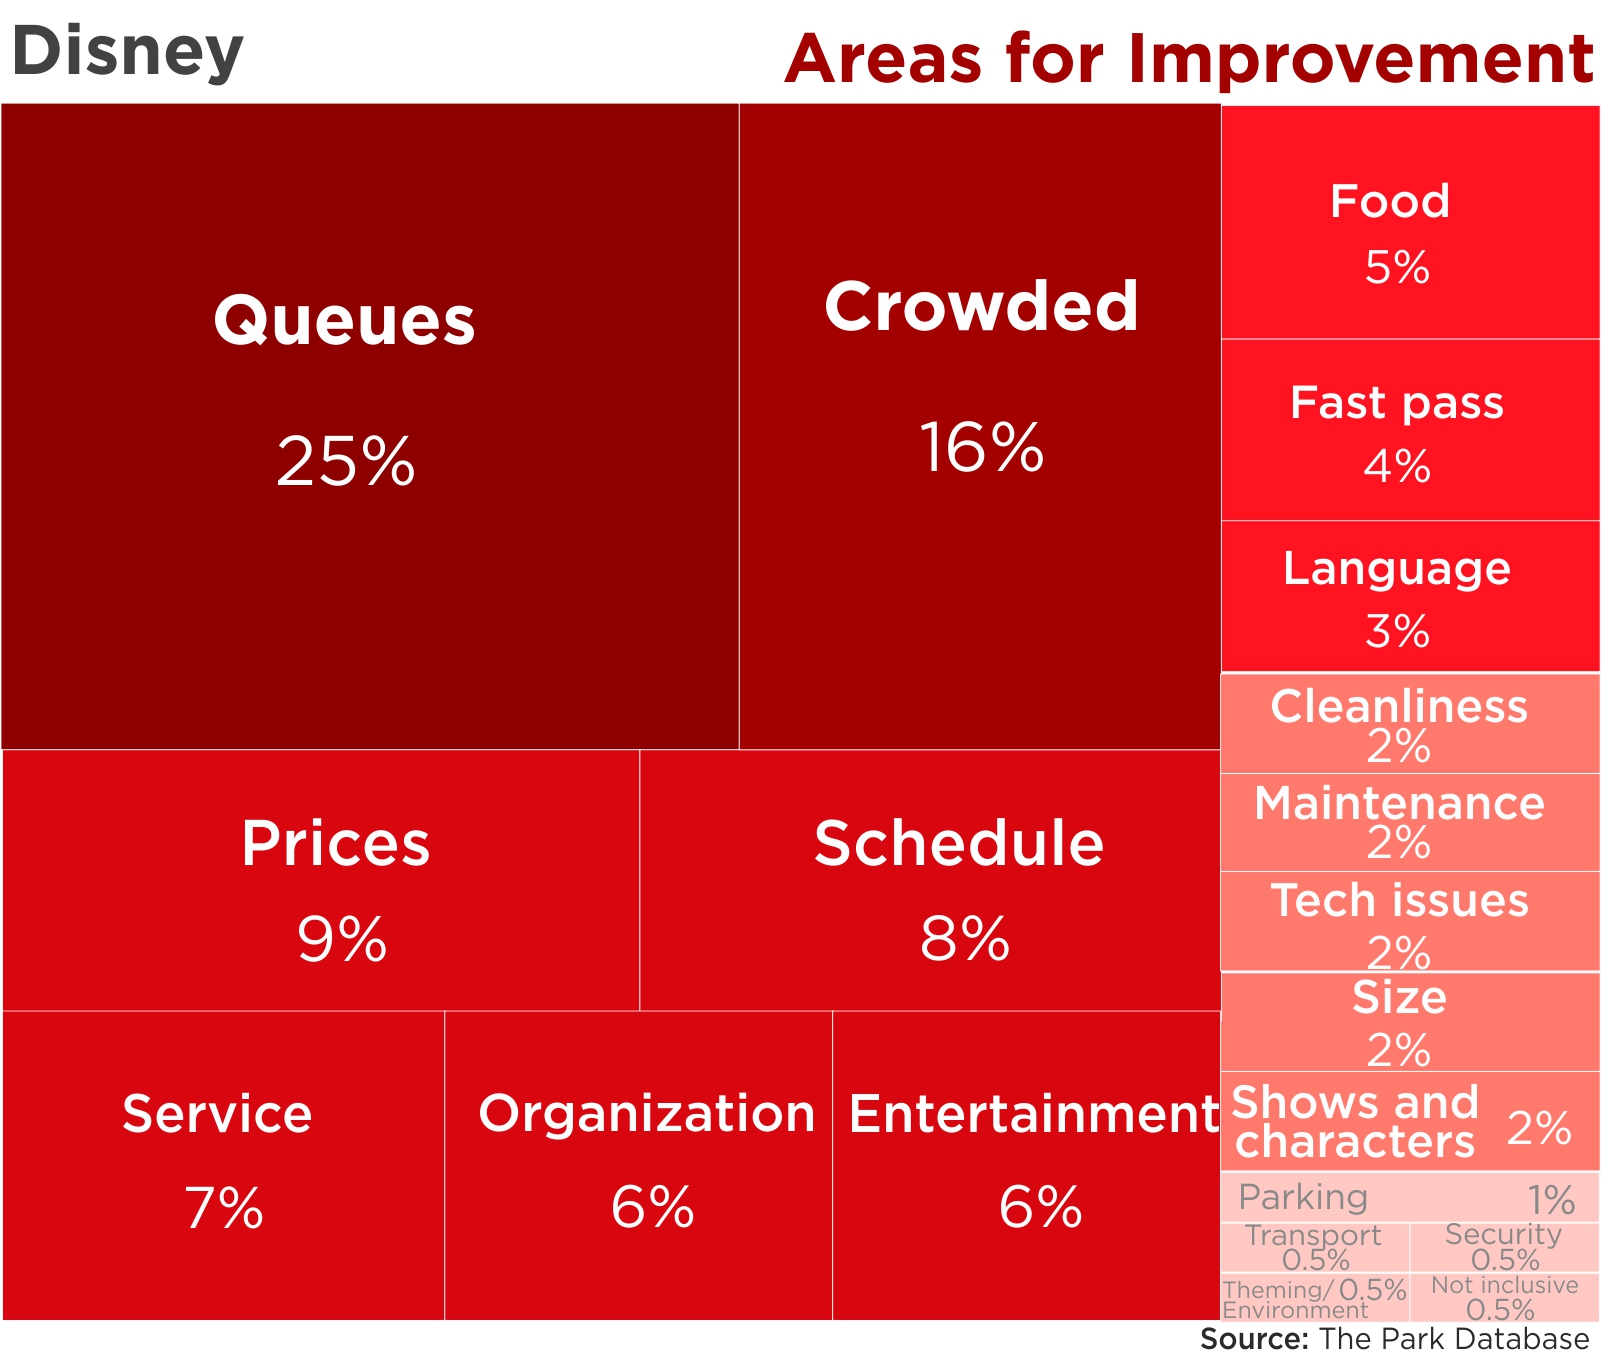
Areas for improvement: crowding and long lines were the most frequent complaints at Disney, with many guests mentioning that the crowding was unbearable, especially with children.
Although, if lines are the worst thing about a Disney park, perhaps it’s a testament to what Disney is doing right, for so many guests to want to arrive!
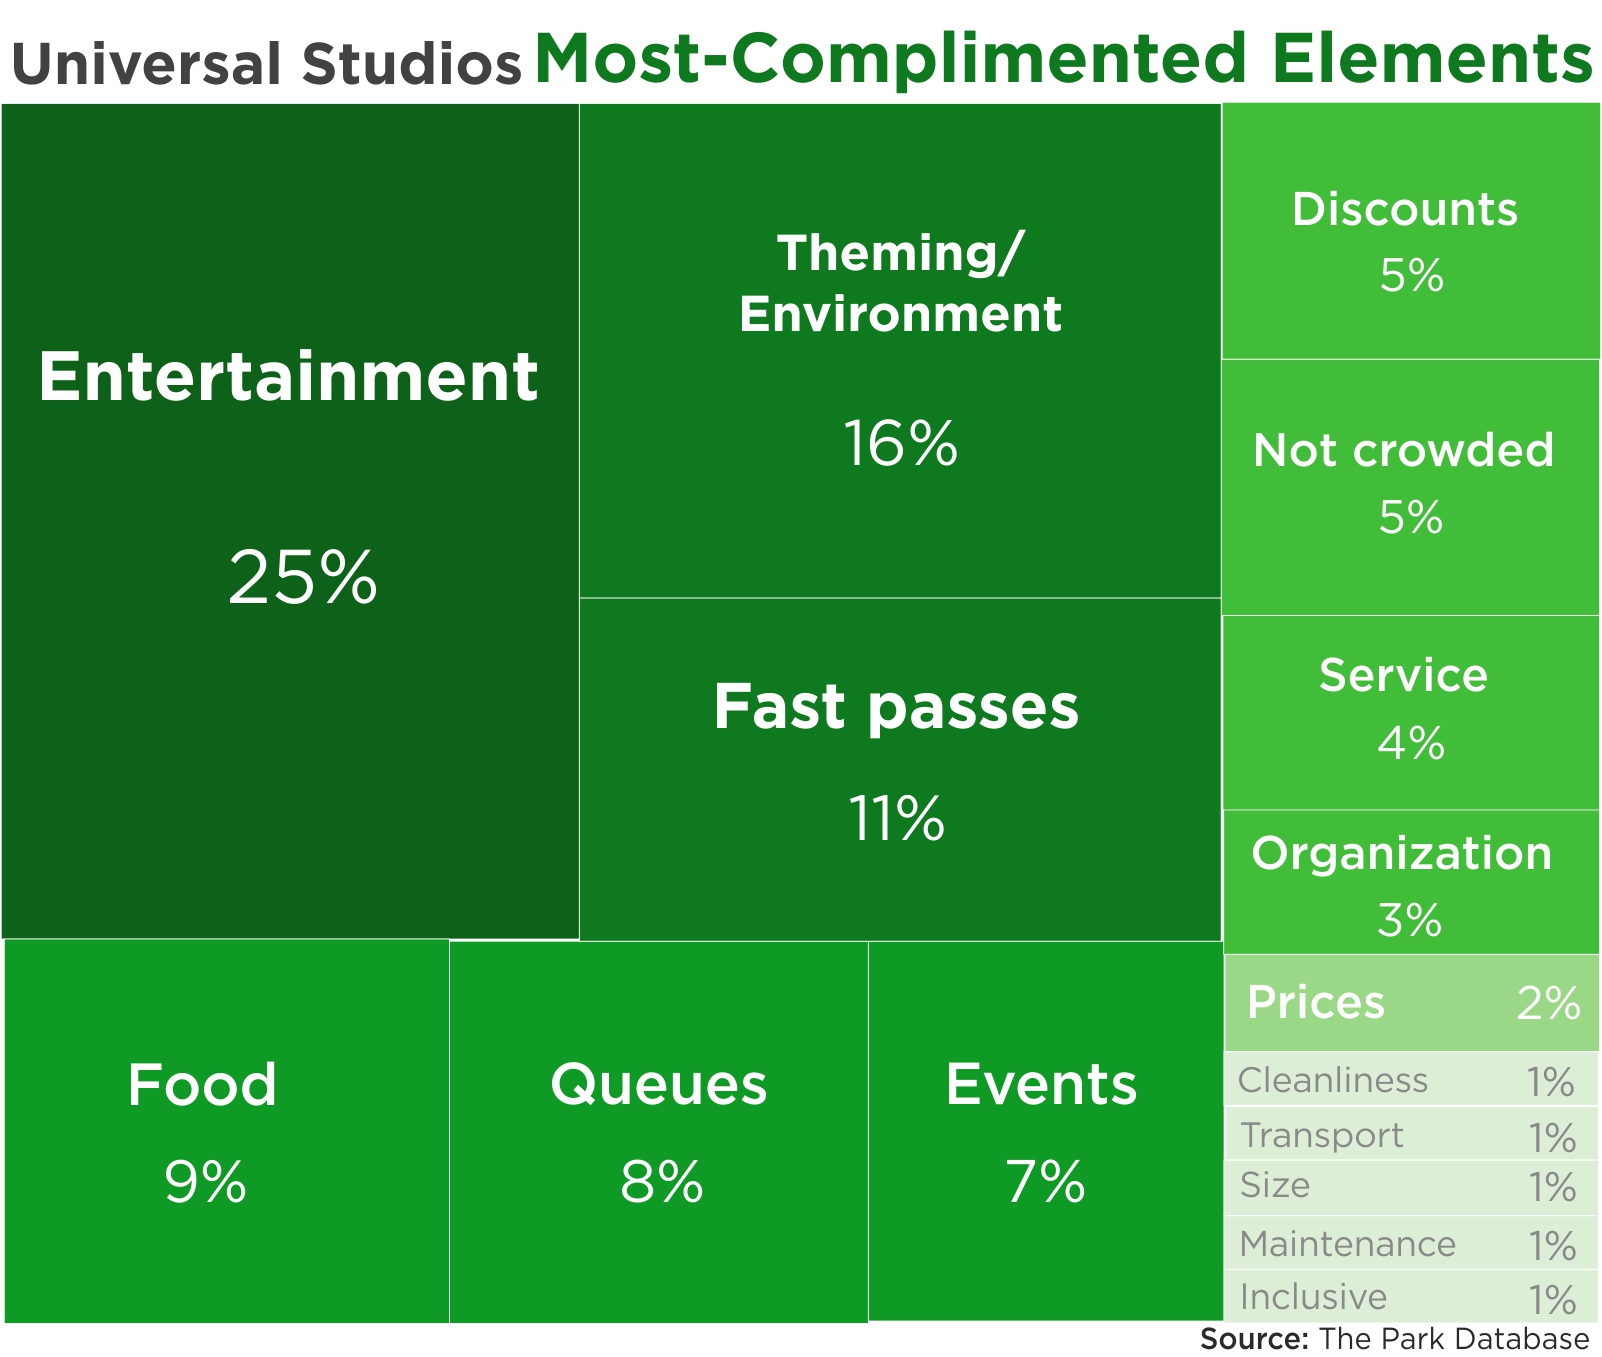
Universal Studios – Social Media
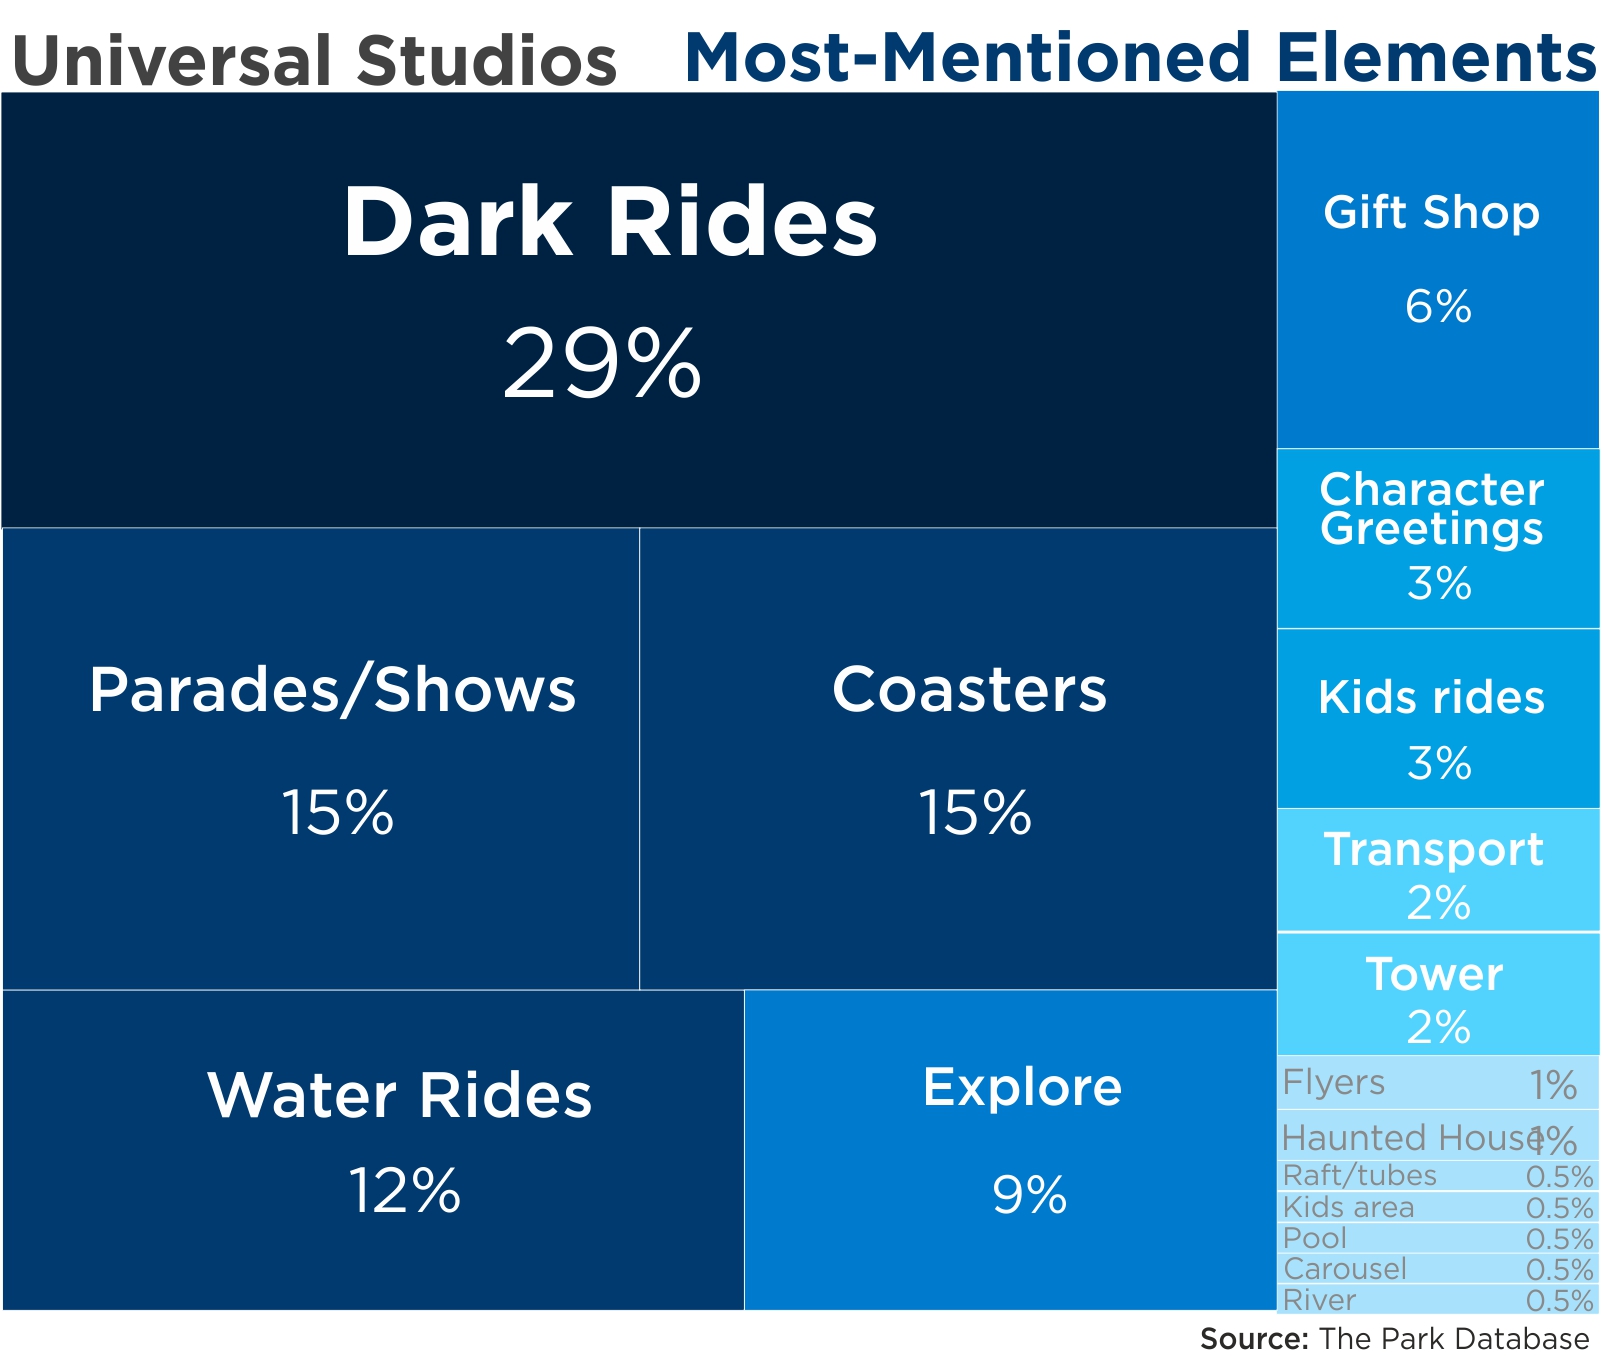
Most mentioned: dark rides were mentioned by name, including the Transformers and the Mummy. Shows, coasters, and water rides are placed in several top slots as well, with the latter’s Jurassic Park a consistently high mention. These are both among the most-mentioned elements, and some of the best things to do at Universal Studios.
Favorable mentions: Visitors were pleased to find entertaining attractions for all ages and proclivities, followed by the theming and environmental design. In the latter category, a consistently high mention was the Wizarding World of Harry Potter, which ranks as one of the best things to do at Universal Studios.
Fast passes were also very popular among guests, although some complained about the high prices.
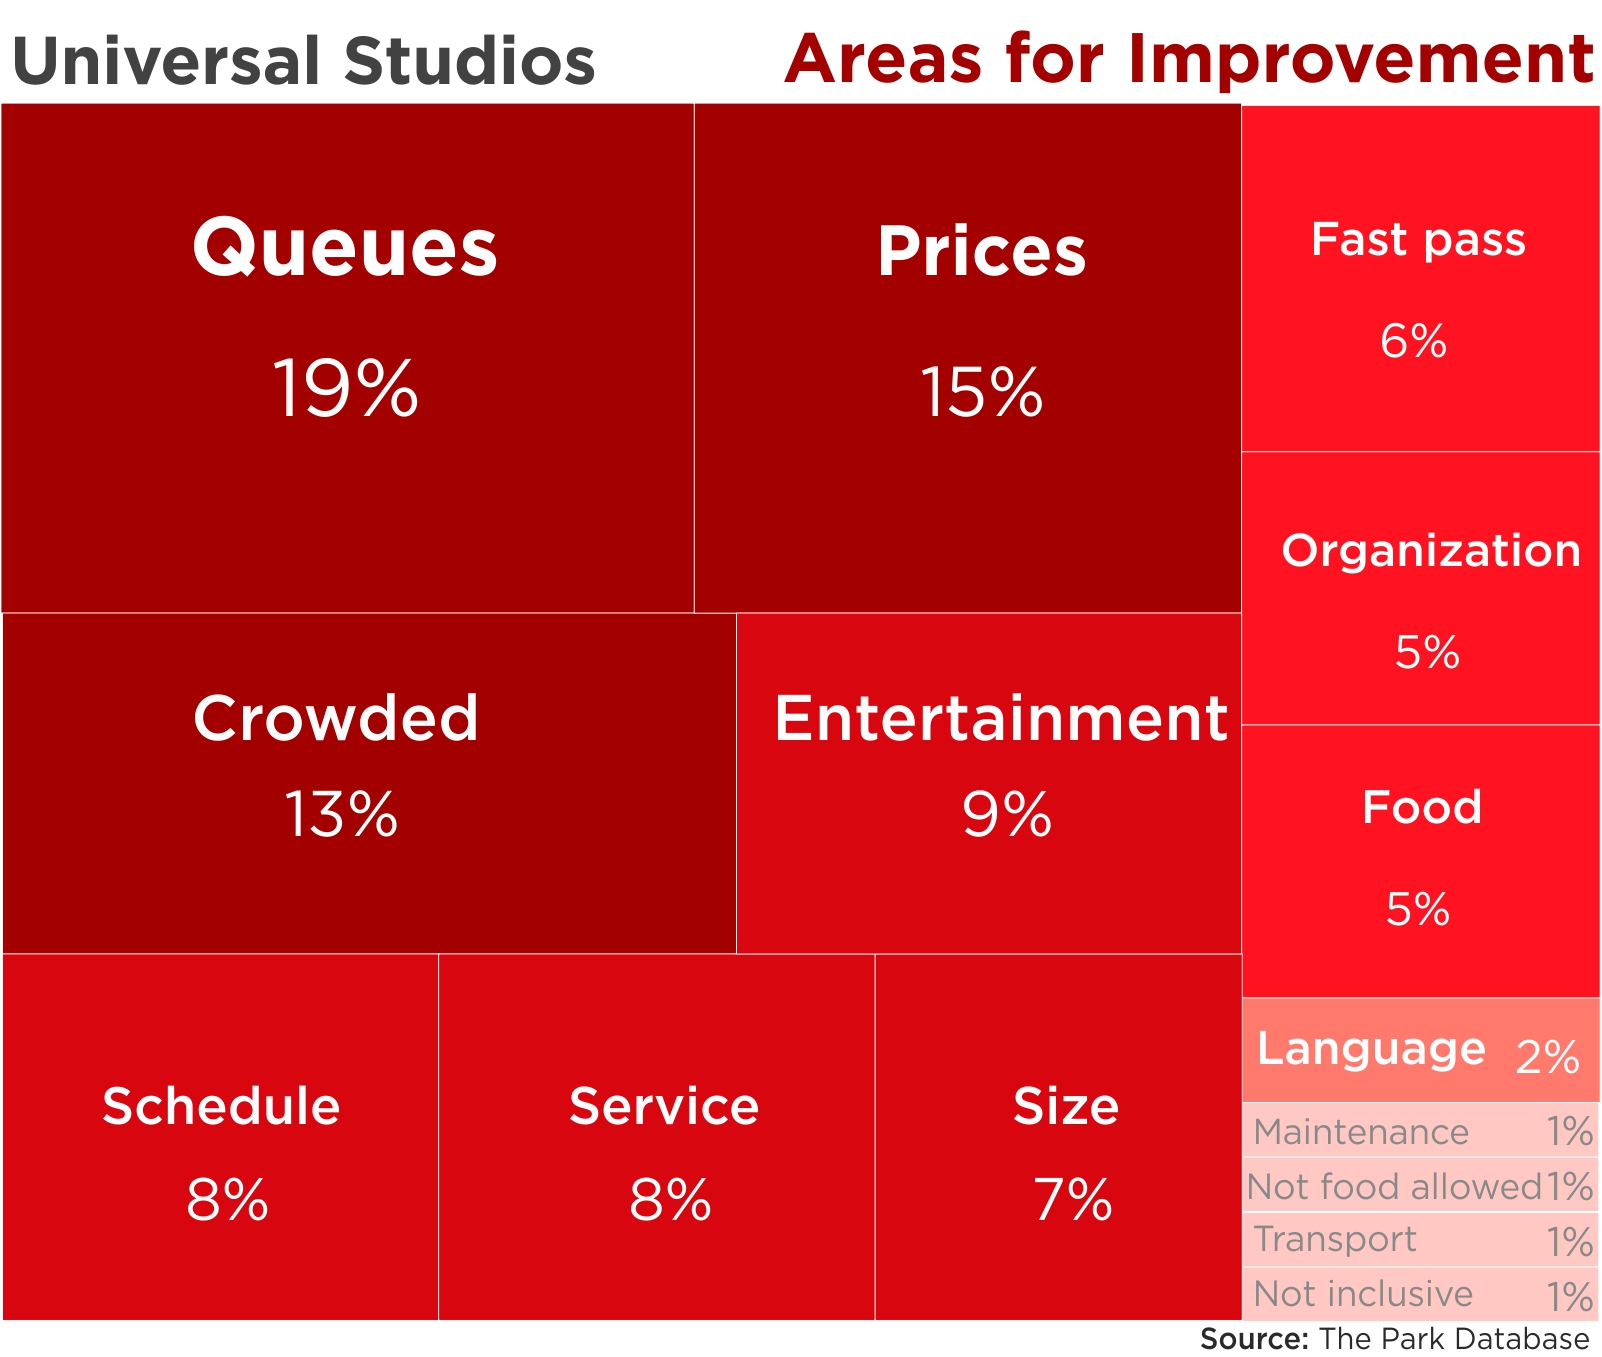
Areas for improvement: queues were the most commonly mentioned complaint, but, many guests actually commented that as bad as the queues were, they were relatively light compared to neighboring parks (Disney). An interesting category of complaints was service and organization, these areas received an equal number of negative as positive reviews.
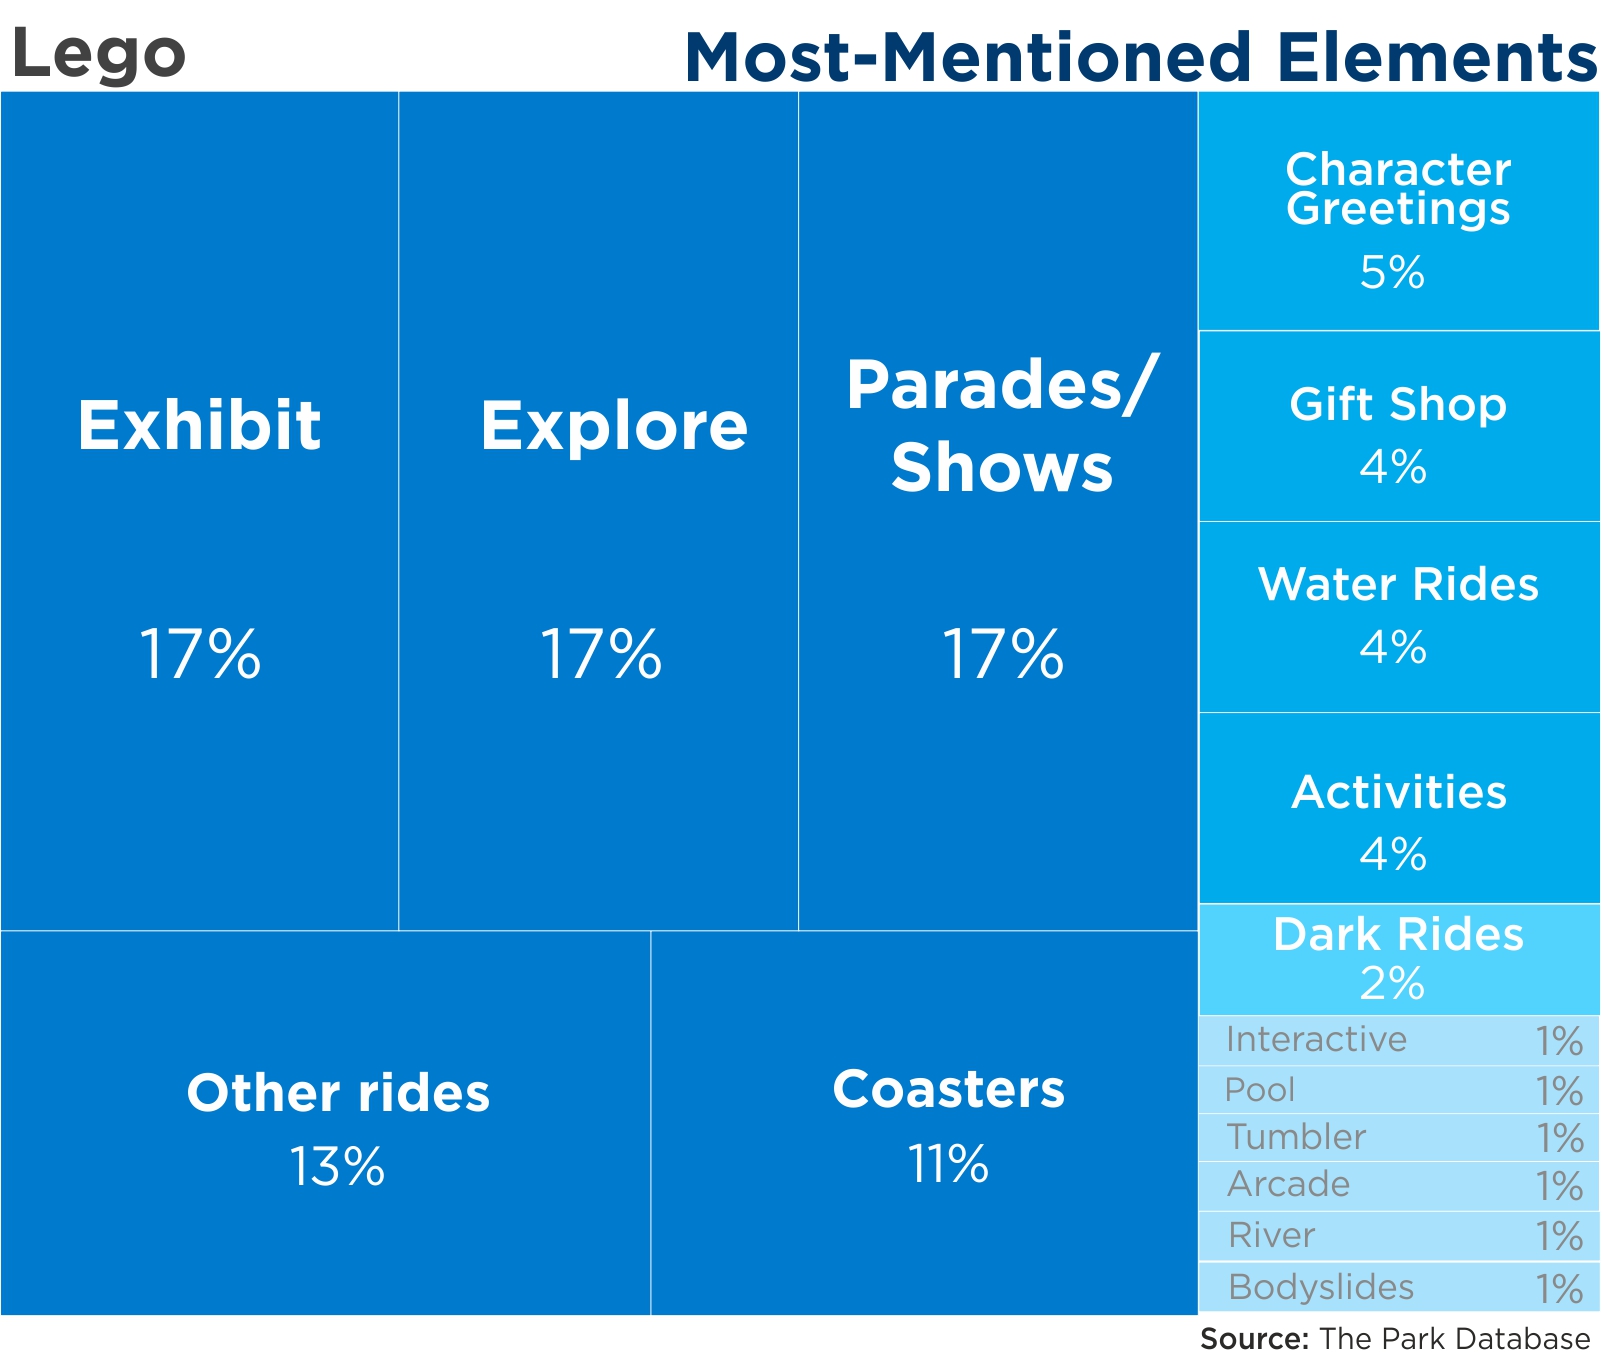
Legoland – Social Media
Most mentioned: befitting its attraction signature, Legoland received a balanced mention across exhibits, explore areas, shows, and rides. Among the best things to do at Legoland are the Lego build areas, as well as the 4D rides, Star Wars exhibits, and architecture exhibits.
Favorable mentions: the top mention was in the Lego theme, guests felt that these were tastefully and consistently done, with several comments on the Ninjago themed areas. Service was also a top mentioned area.
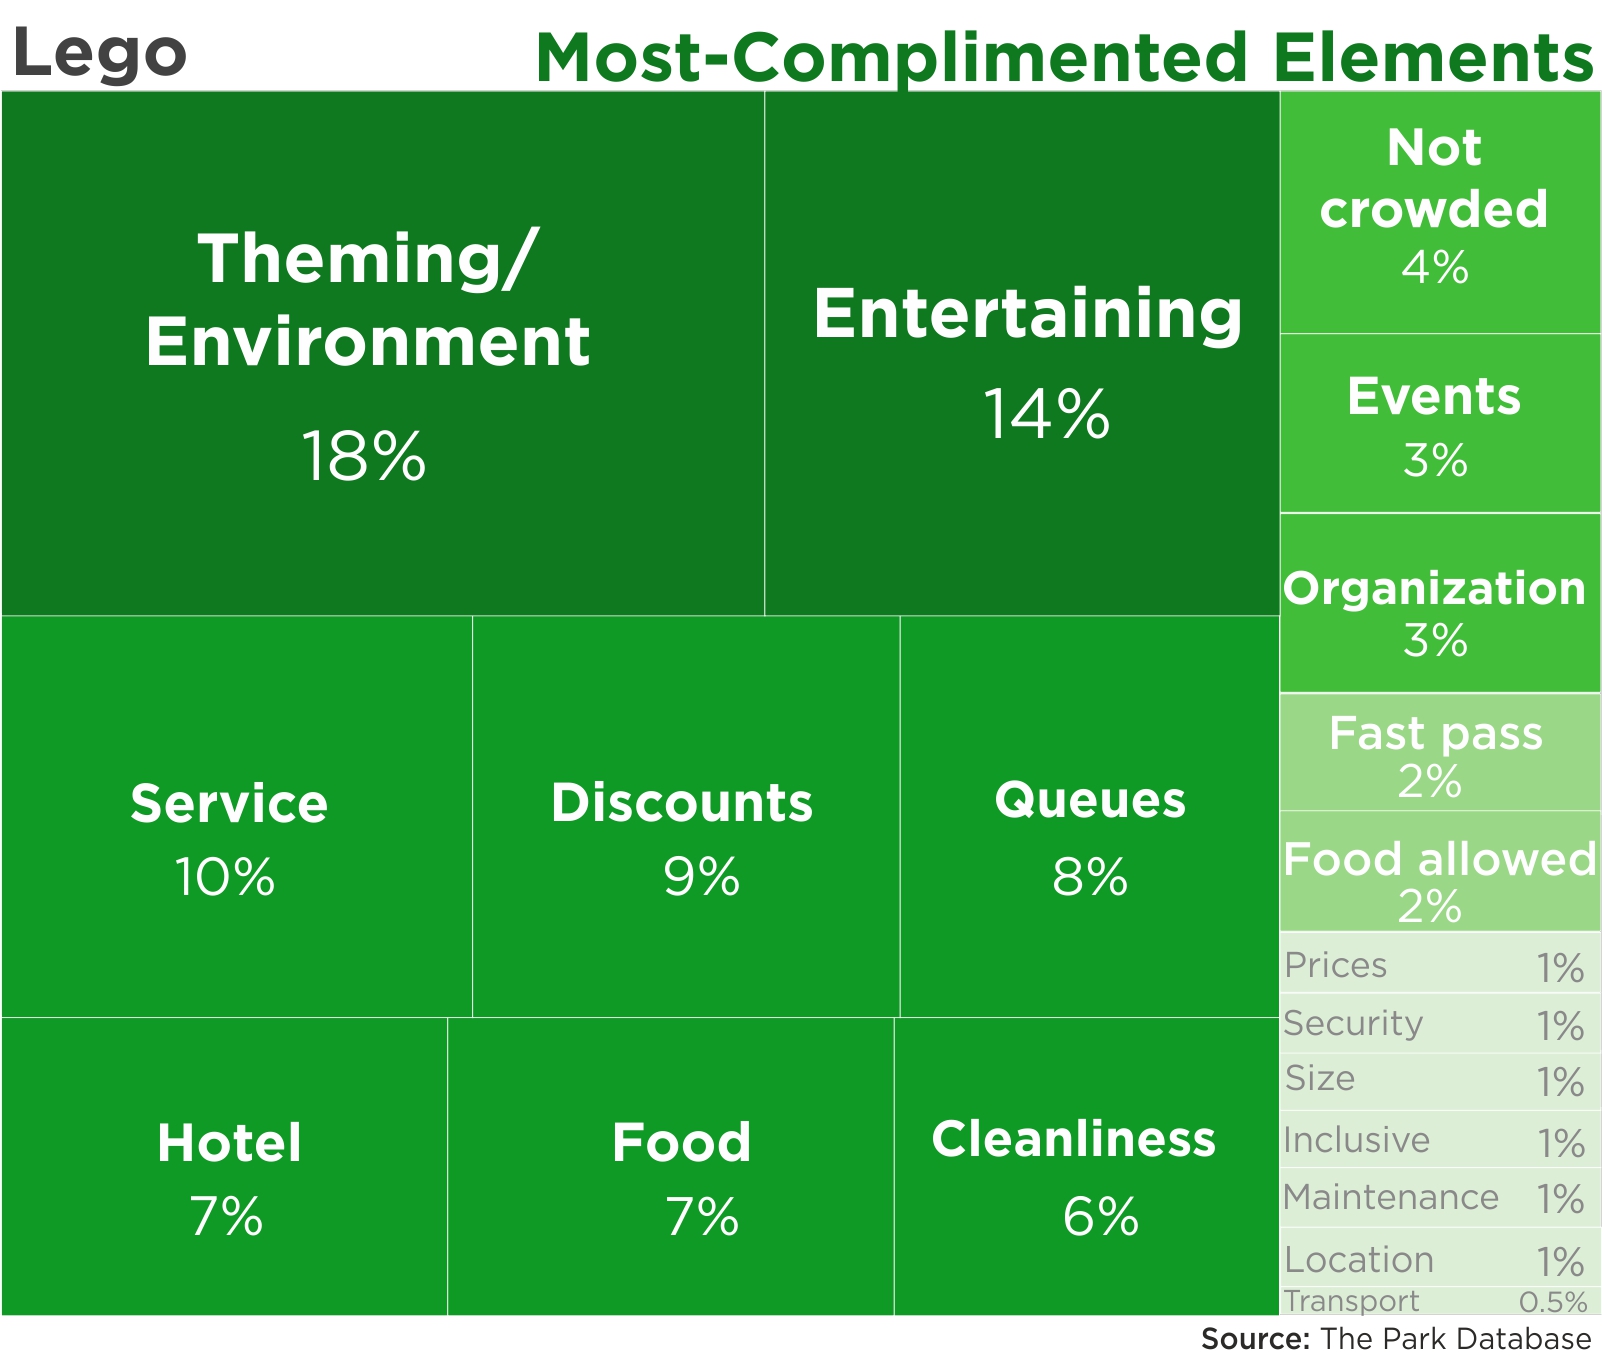
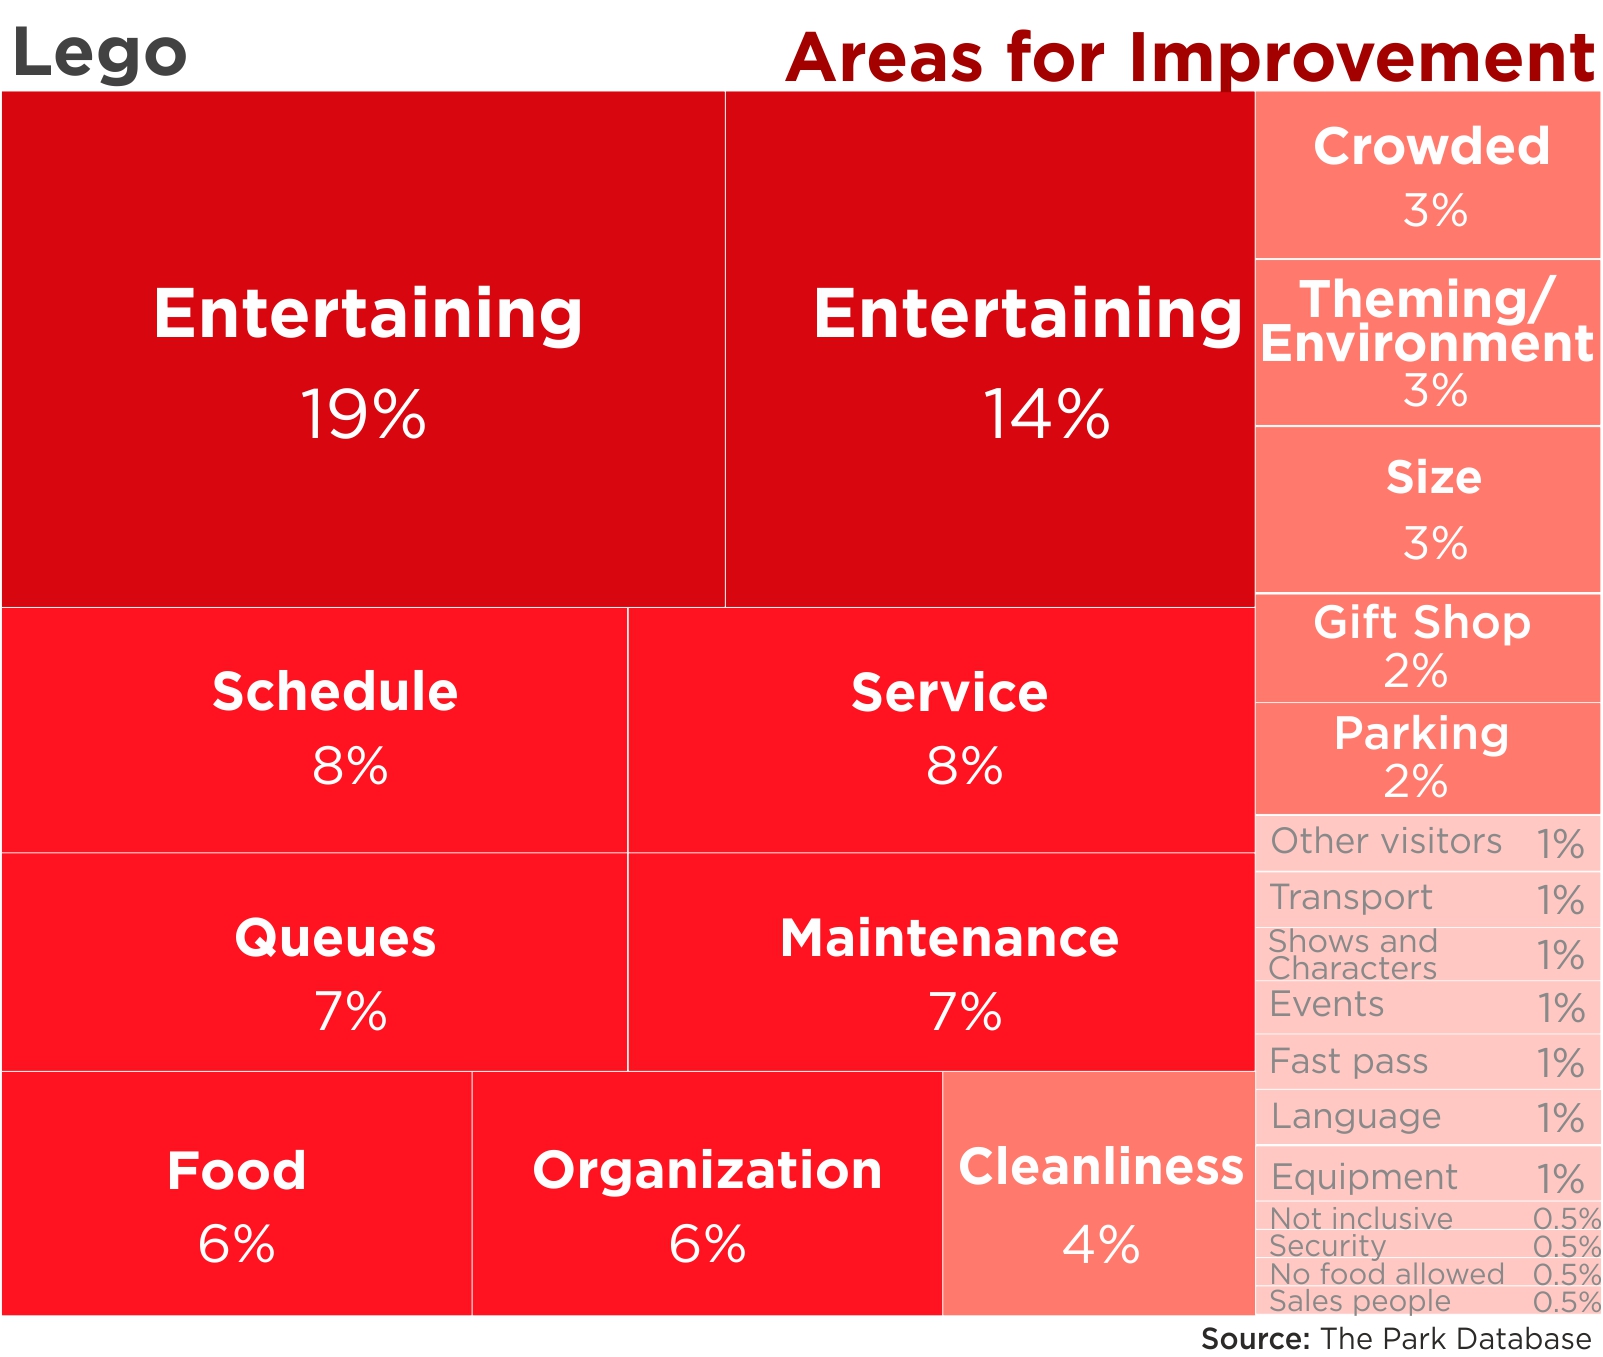
Areas for improvement: the main issue for Legoland parks was the lack of entertainment diversity, this was the most consistently mentioned complaint for the park. The park schedule was also a frequently mentioned complaint, with visitors mentioning that some parks didn’t respect the actual opening/closing hours stated on their websites, and attractions closed for maintenance or understaffing issues.
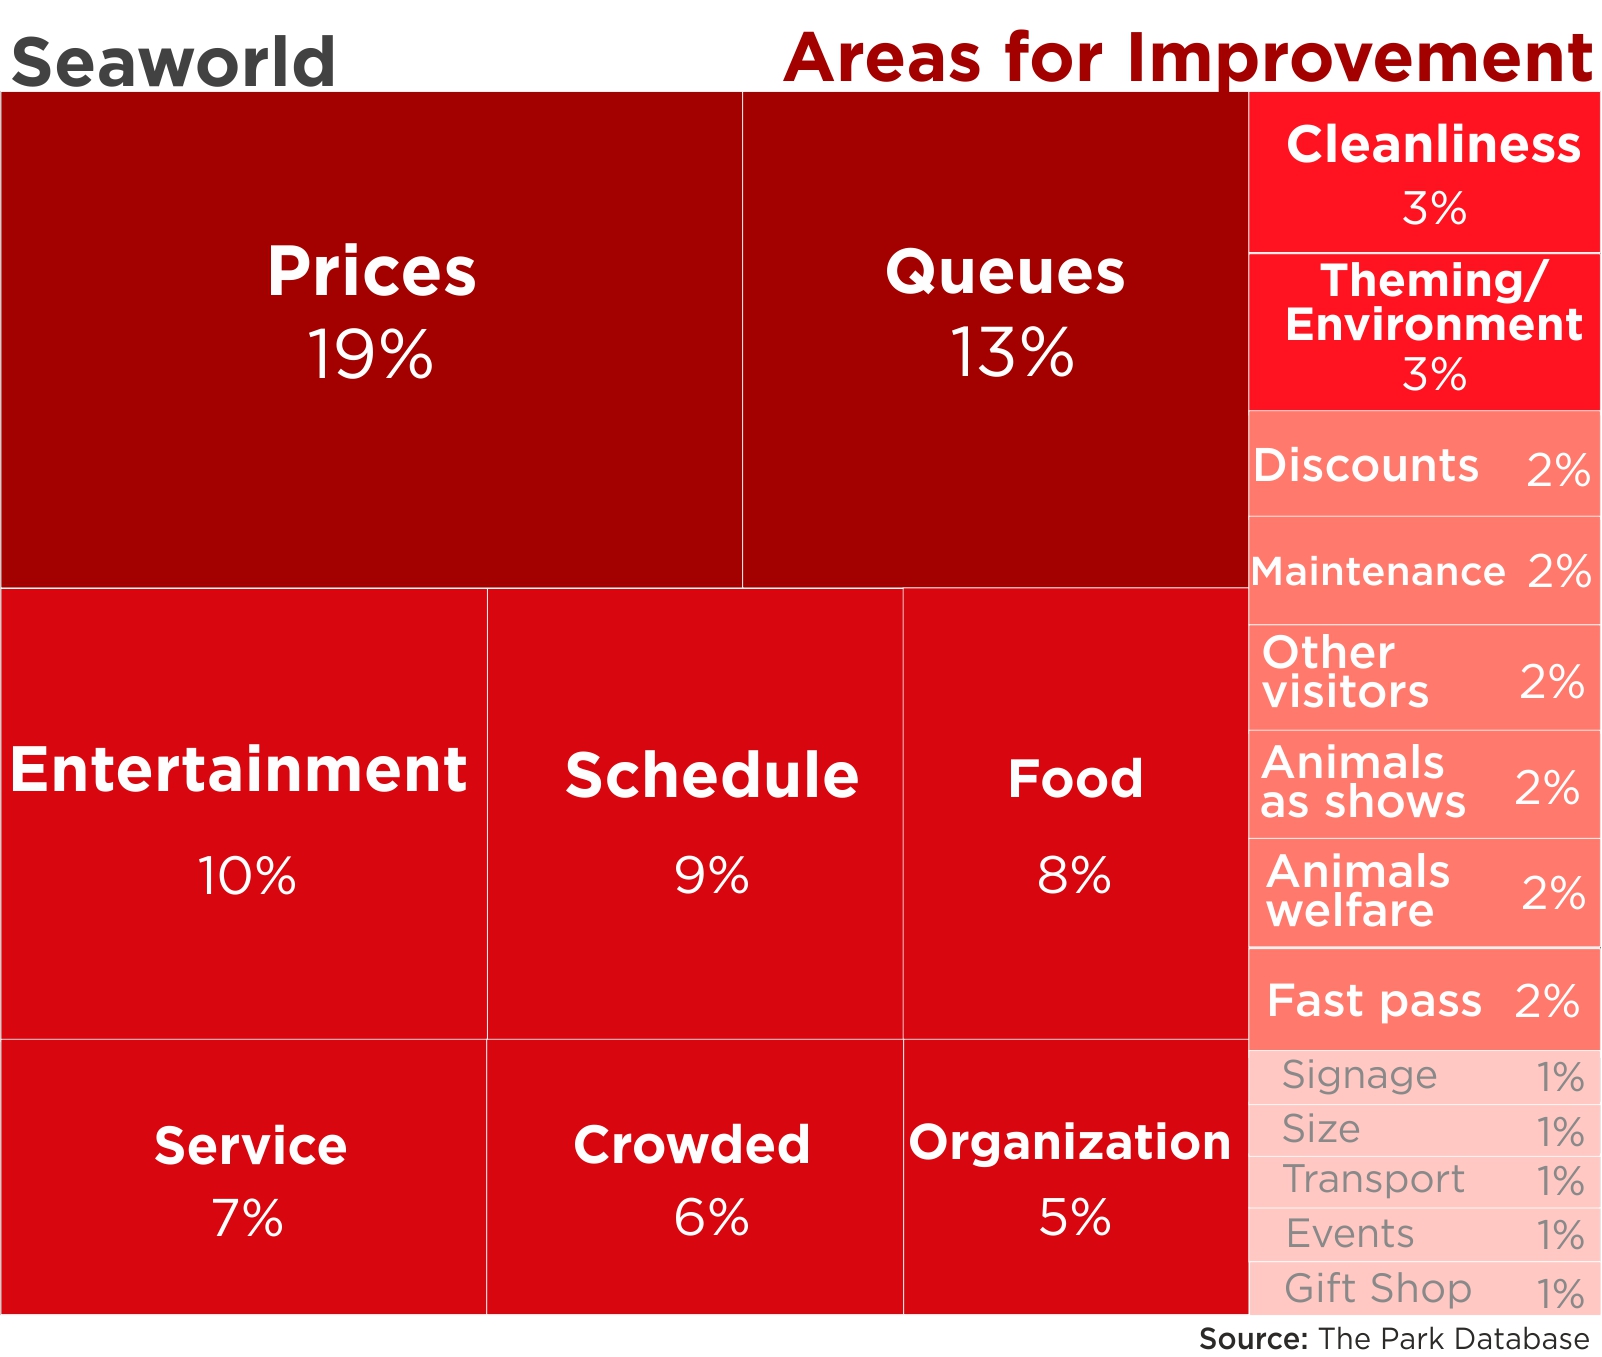
Seaworld – Social Media
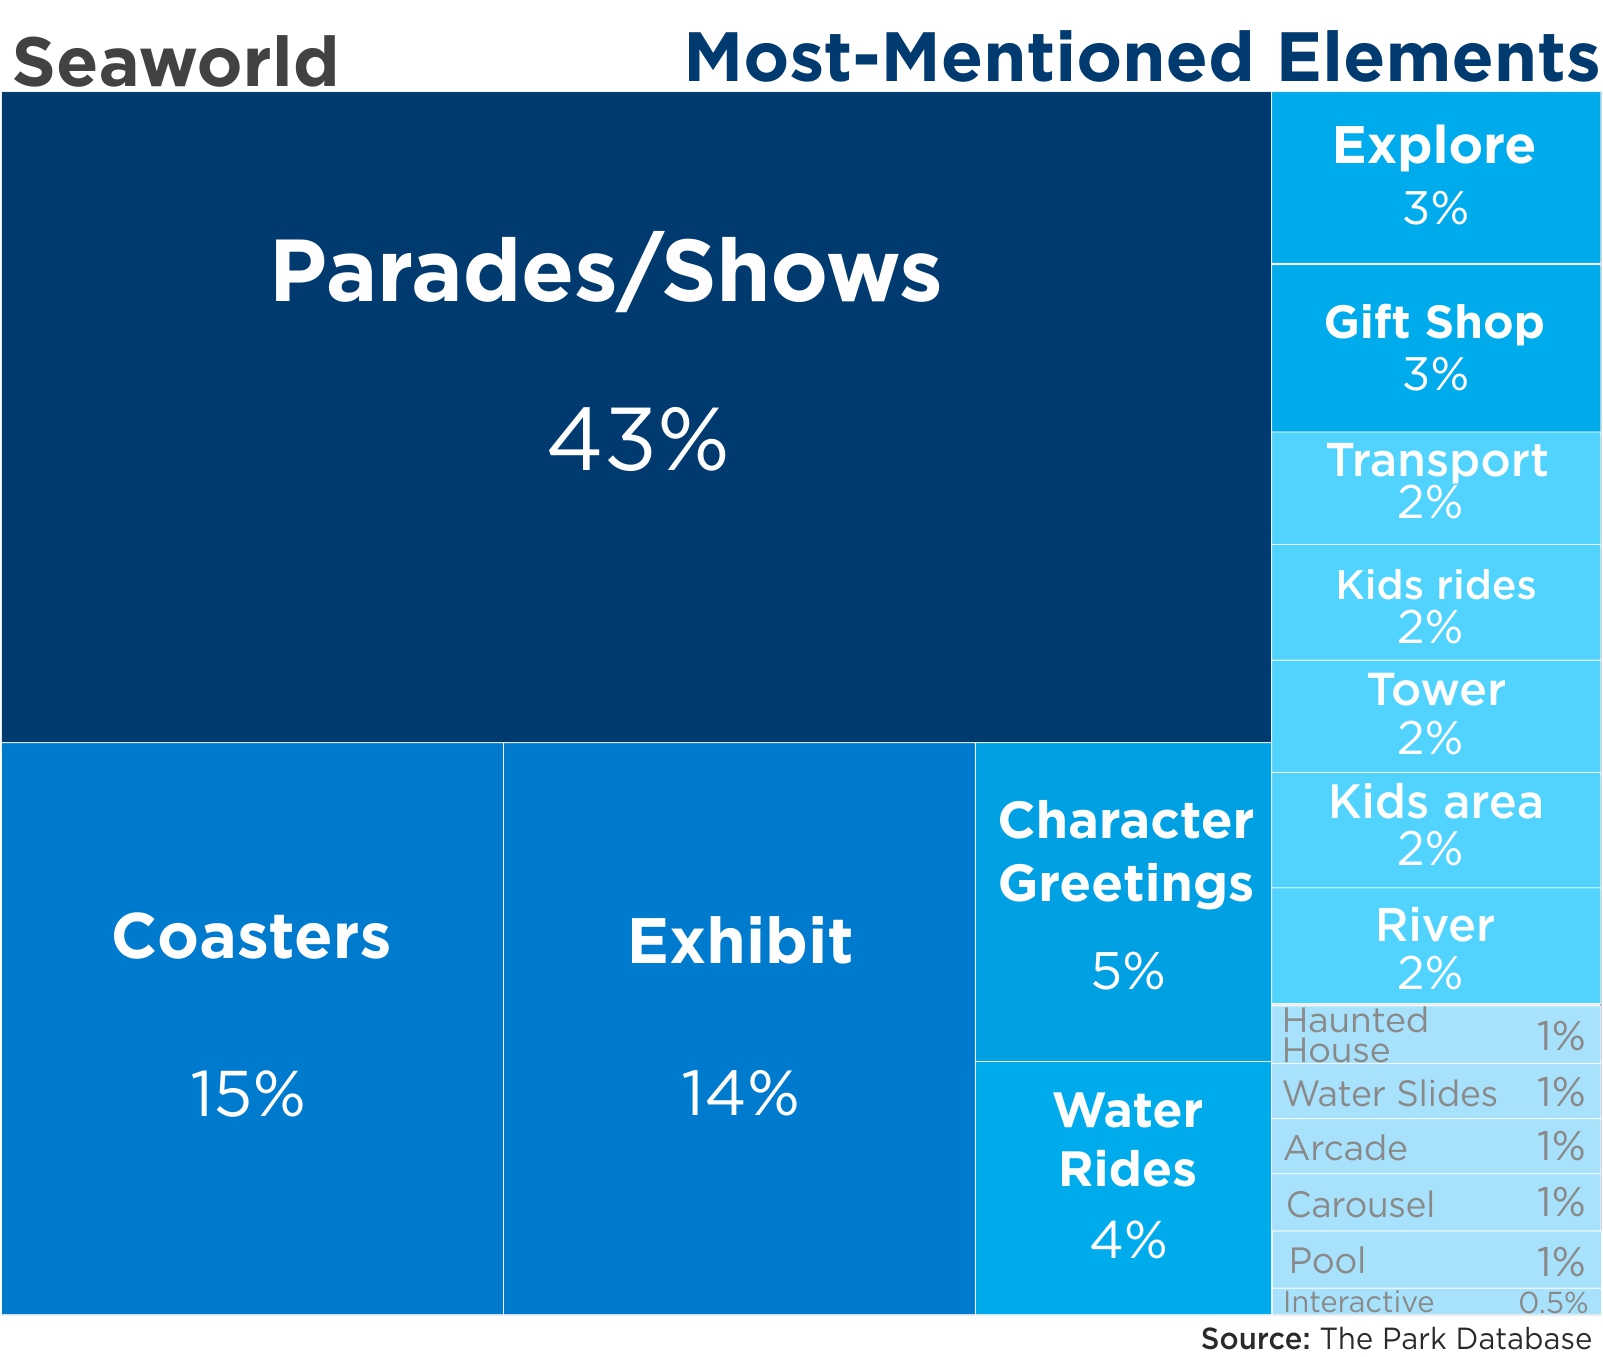
Most mentioned: Animal shows, of course, were the most-mentioned element at Seaworld parks. In the post-Blackfish era, however, it was refreshing to see that many visitors expressing their satisfaction at seeing a change in the wild animal shows and rescued pets.
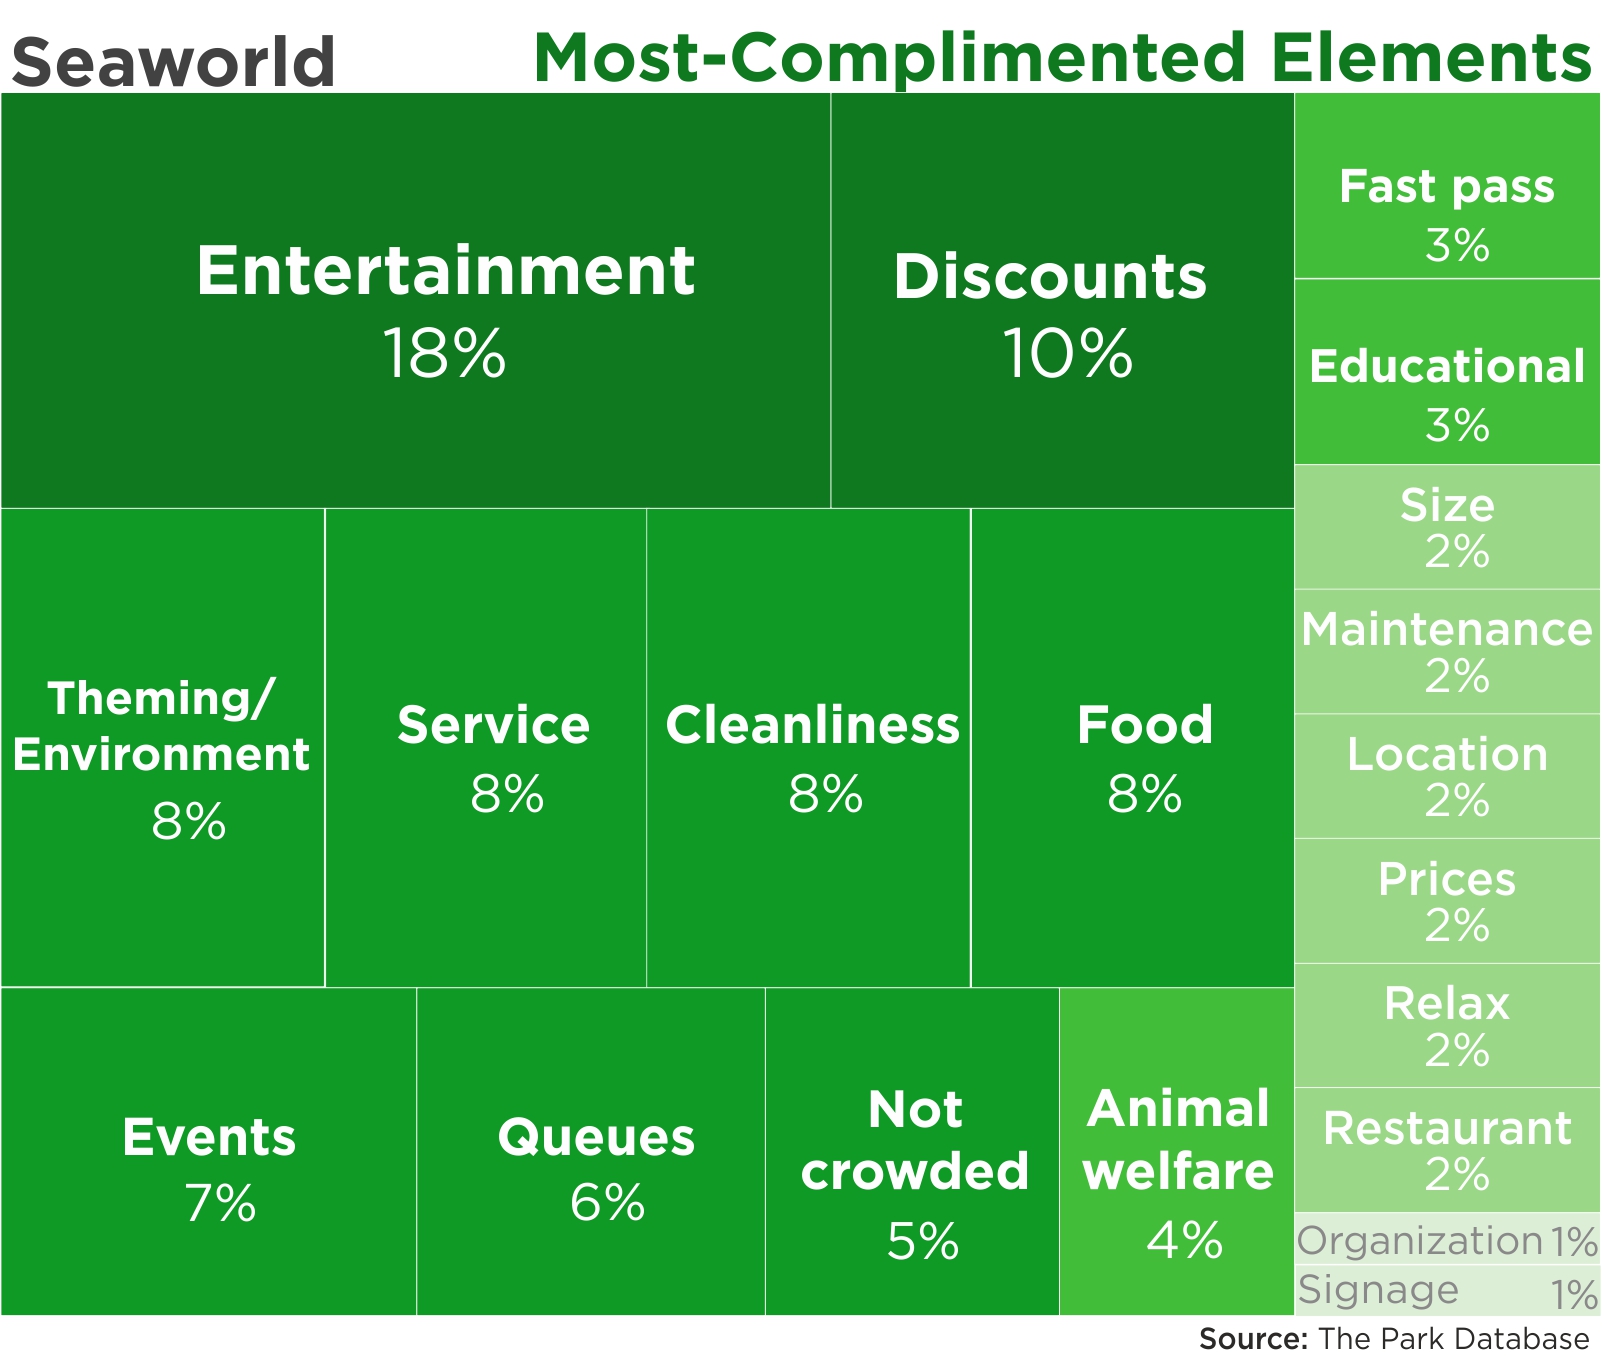
Favorable mentions: the diversity and variety of Seaworld parks that offer a mix of rides, exhibits, and shows; i.e., something for everyone, was an aspect that was surprising and something that outshined every other park category in this review. This principle was, far and away, the best thing about a Seaworld park. Discounts were a close second.
Areas for improvement: Prices for parking and food and beverages were the most frequently cited complaints. Long queues and scheduling also received negative reviews; visitors consistently mentioned closed food and merchandise outlets, even after the parks had opened.