Sizing an attraction correctly is one of the primary issues in the planning phases of development. Size too small, and operations will suffer during peak days, leaving money on the table. Size too large, and you’re simply overbuilt – and wasted money.
So how do we build an attraction to the right size? As with most issues in attraction development, the principles are simple, the actual analysis a little more complicated.
Hourly Peak Visitation
Typically, we size an attraction against a measure known variously throughout the industry as the Onsite Design Day, Intraday Peak, Peak Onsite, Peak In Park, Onsite Peak, or Hourly Peak.
Of these, we’ll use the terms Hourly Peak or Peak Onsite here.
Despite all the confusing names, this measure is simply the number of visitors in-grounds in the theme park or FEC during the peak hour. During a typical operating day, there will be ebbs and flows in visitation as crowds enter and exit the park. In almost no cases are visitors perfectly evenly distributed throughout the day.
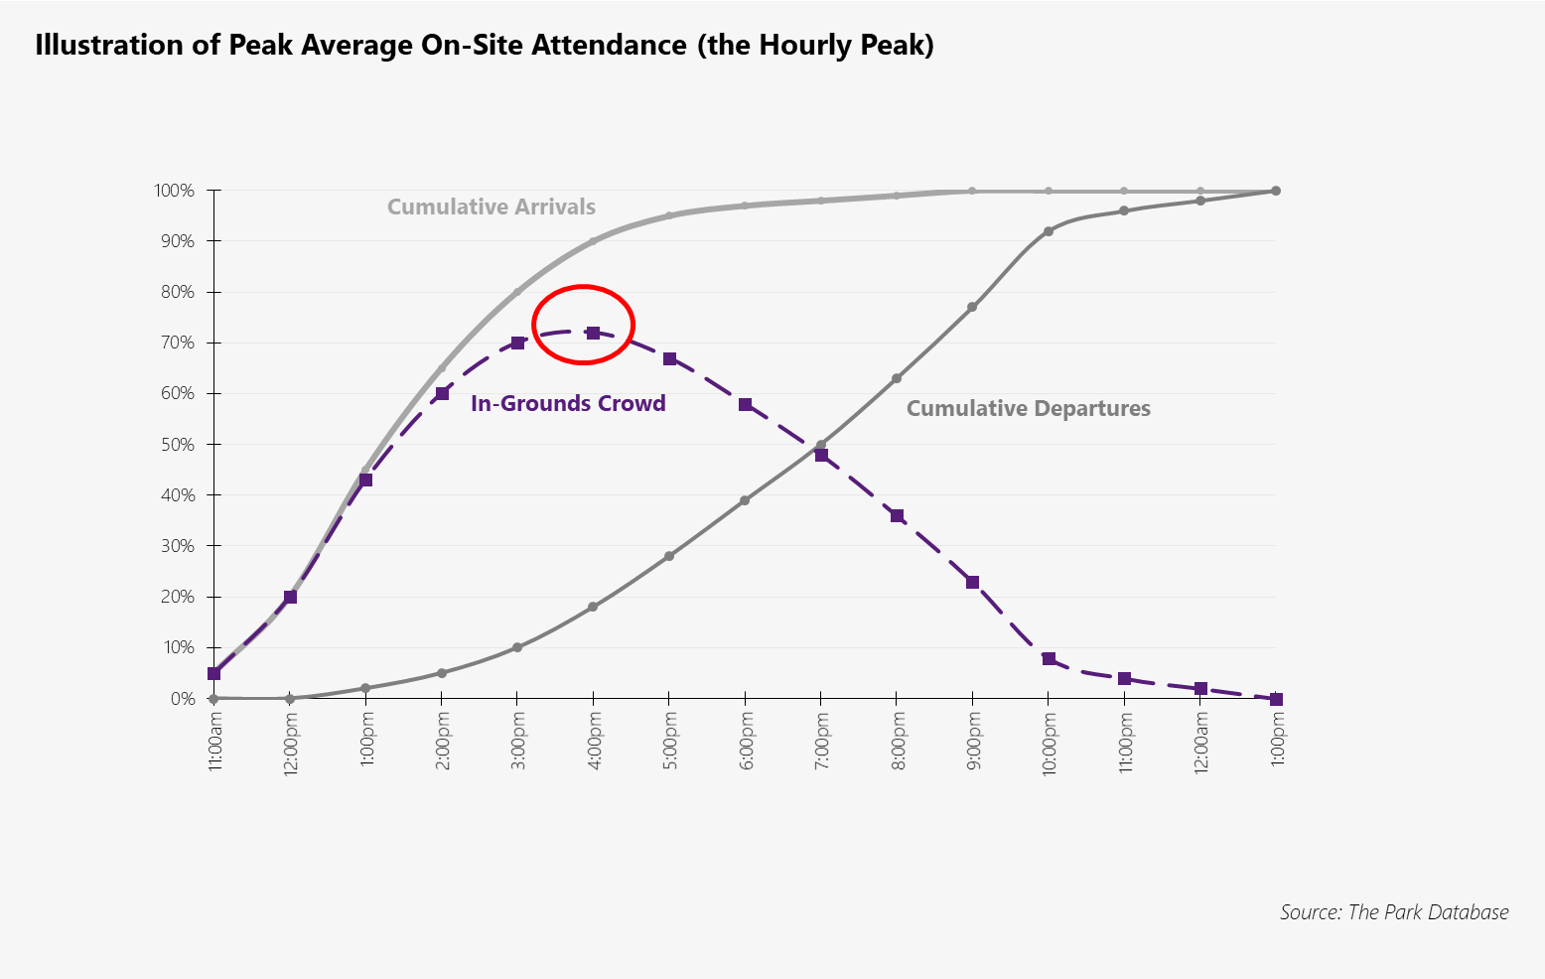
Well, this Hourly Peak measure represents that reality: during what hourly timeframe are visitors most concentrated?
Sizing Ratio
In order to arrive at sizing, we use the Hourly Peak visitation figure and apply a sizing ratio.
Sizing ratios differ by type of attraction, and are expressed as units of density: i.e., how much space do we afford guests during the most crowded time?
Selecting the right ratio is the province of experiential designers, and is more art than science. While standard industry ratios for the optimum amount of ‘space’ among crowds have been as low as 3-4 sqm/guest for indoor parks, and at least 10 sqm for outdoor parks, these guidelines are almost guaranteed to change in the post-COVID era.
Masks or no masks, social distancing or not, the core question remains the same: for the nature of the attraction being planned, what is the optimal amount of space required to give visitors the sense that they’re engaged in a social experience, while avoiding overcrowding?
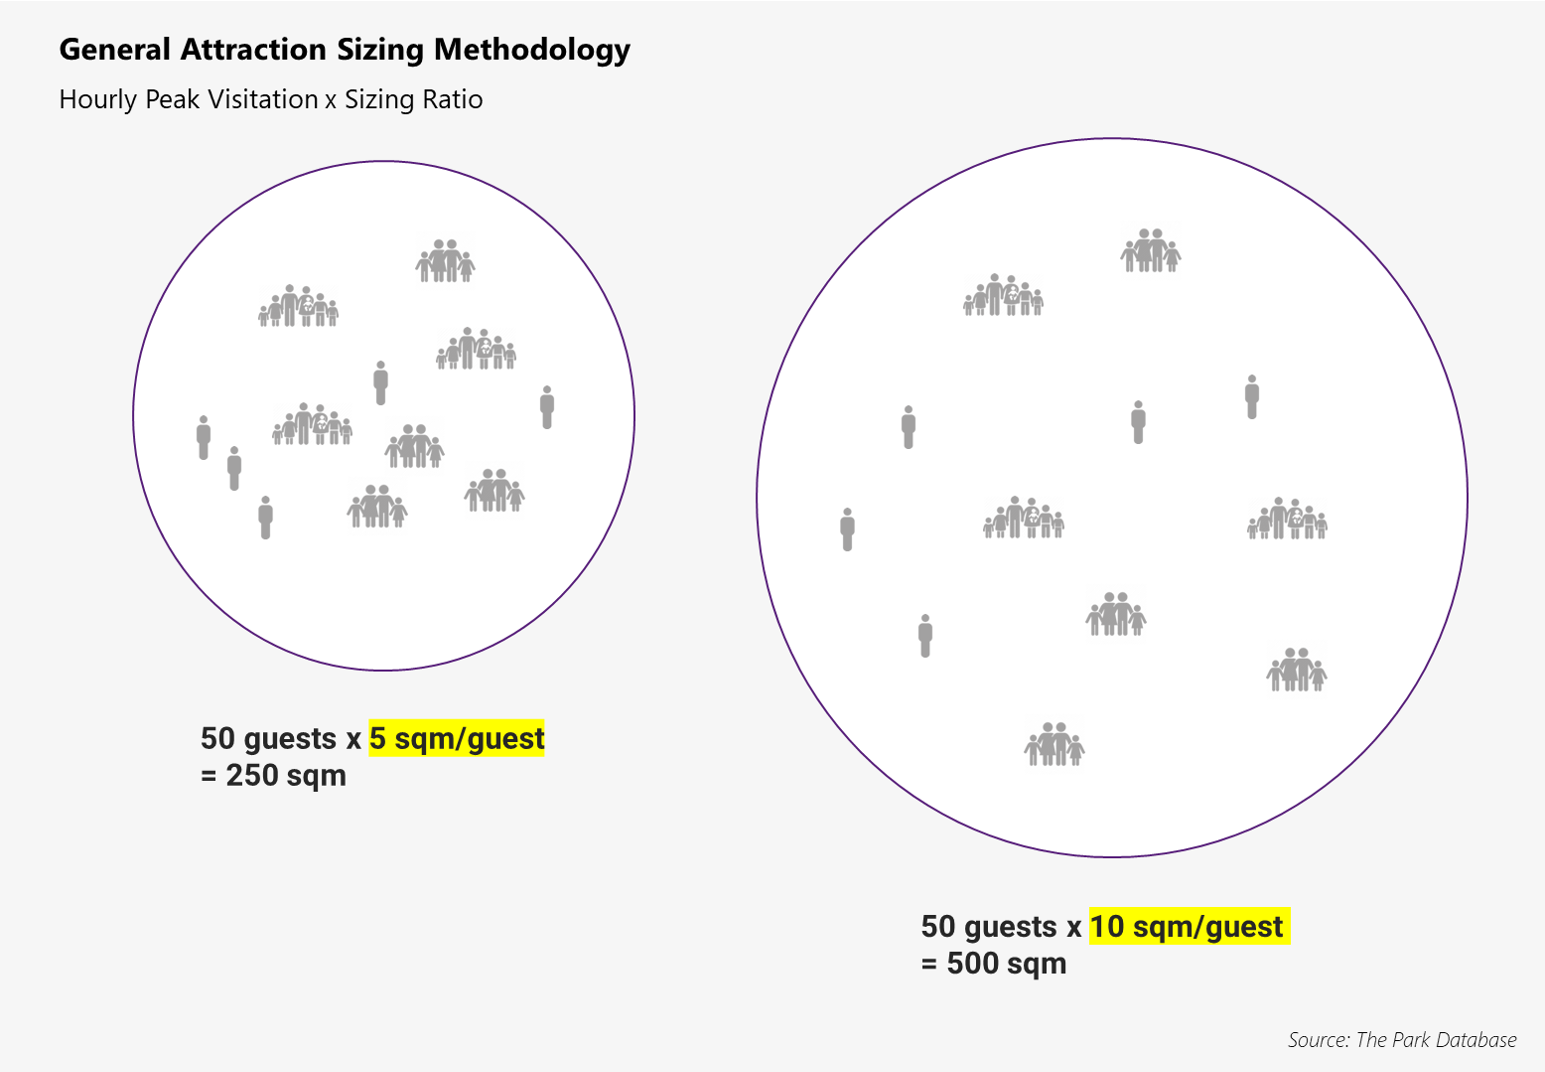
As seen in the illustration above, a smaller ratio (more dense) results in smaller grounds for the park. Conversely, a larger ratio (less dense) results in larger grounds.
But now you might be saying, how do we derive the Hourly Peak in the first place?
Design Day
Just as attendance is rarely distributed evenly throughout the day, neither will theme park visitation be evenly distributed throughout the year.
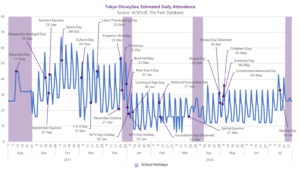
Any given day’s visitation will be subject to patterns of seasonality based on the day of week (notice the spikes correspond to the weekends), month of year, holiday seasons, school schedules, etc.
In order to account for this pattern of seasonality and peaking, the attraction industry uses a measure known as the design day.
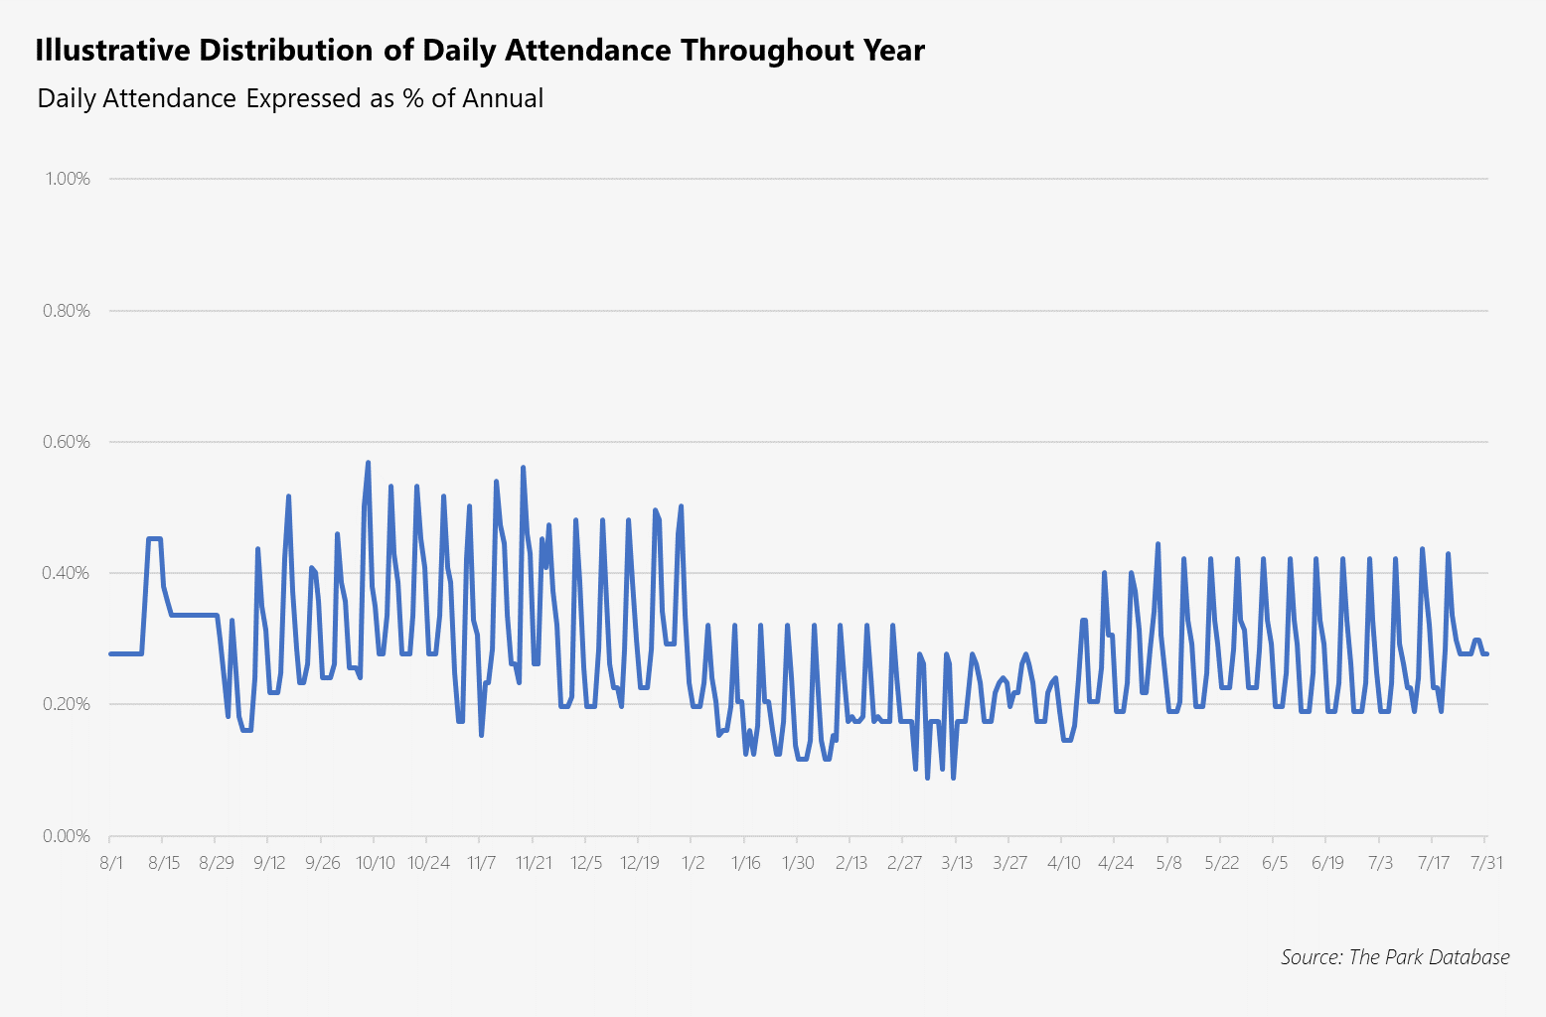
Notice in the chart above that the highest spikes in attendance seem to occur around the September/October timeframe.
If, for instance, we were to design a park that ignored this reality and was designed for an average May/June level of attendance, we’d be leaving a lot of money on the table. Nearly 20-30% of potential September/October visitors would be turned away at the turnstile.
Conversely, it likewise wouldn’t seem prudent to take the highest spike on the chart and design a park around the absolute peak day. A park designed to this standard would feel empty on just about every day aside from that peak day.
Instead, we might take an average of the highest attended days and design to that standard.
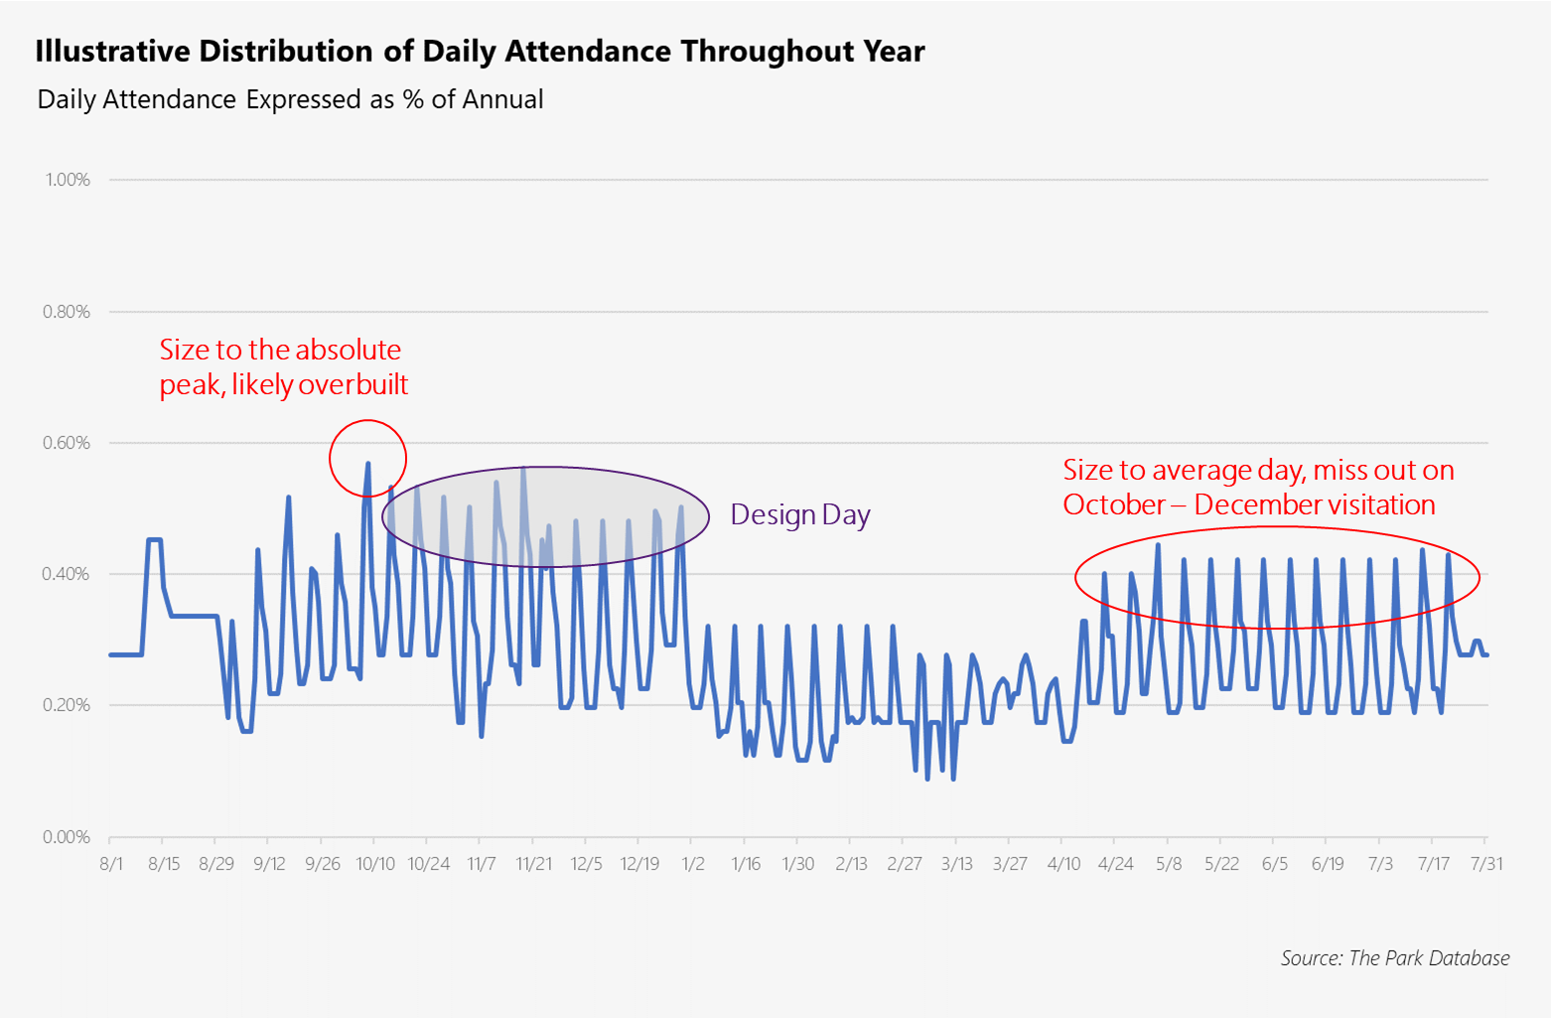
This is what we are referring to as the design day. It’s the theoretical average of the highest attended days of the year. Not the single absolute highest peak day.
So how do we arrive at a design day?
The general methodology is to identify the various seasonal, temporal peaks in attendance, and filter down by granularity. That is, identify and isolate:
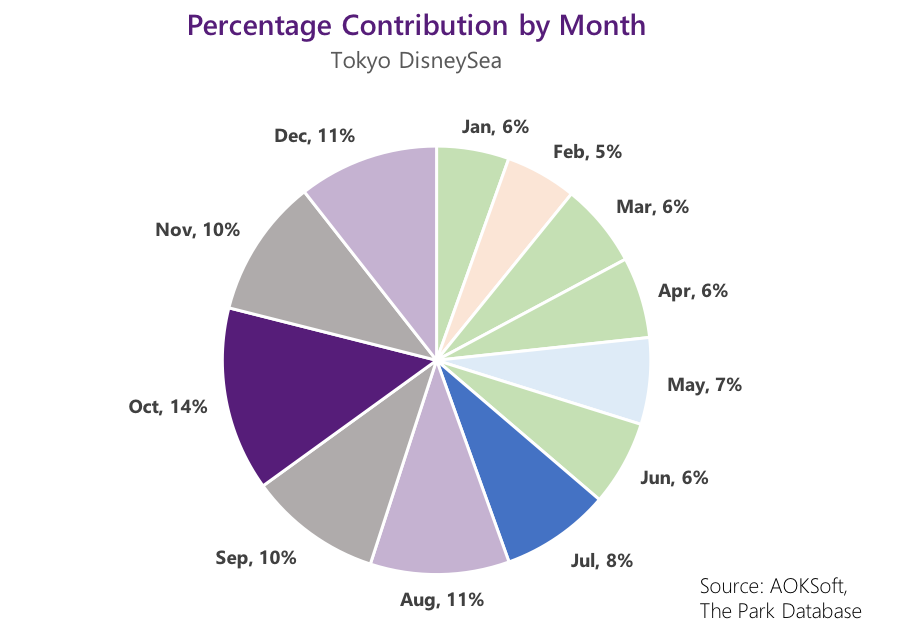
Monthly Peaking Ratio
Identify the monthly peak in visitation throughout the year, expressed as a % of annual attendance. For both patterns of tourism and theme park visitation, there are identifiable peaks by month. In Europe and the United States, these peaks correspond to July/August periods. In China, two peaks around the Golden Week holidays (~January/February, October) are common. In Saudi Arabia, this would be the Hajj month. In the example below, DisneySea appears to peak in October (with 14% of the year’s attendance).
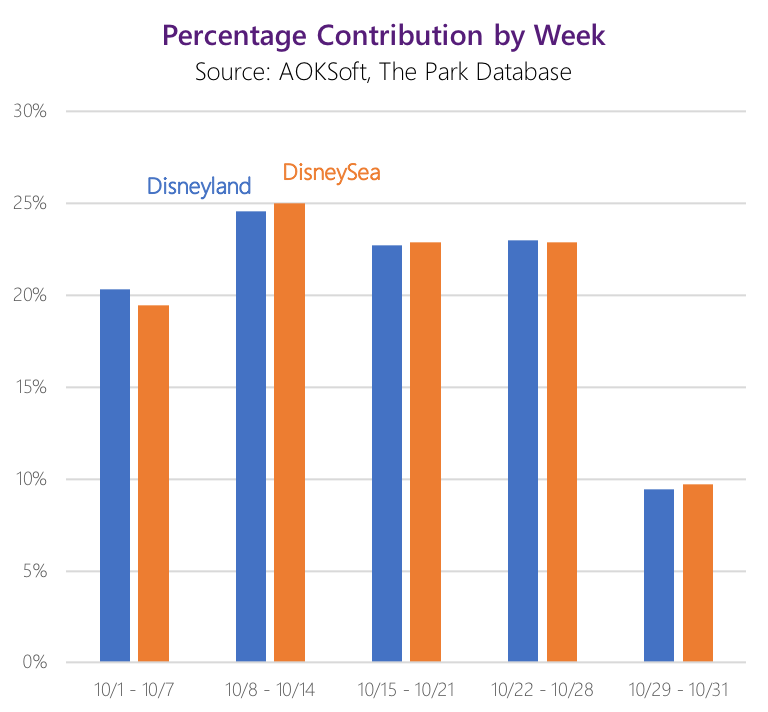
Weekly Peaking
Estimate the peaking associated with the highest attended week of that month, based on patterns of seasonality and visitation. This would be expressed as a % of Monthly Peak Attendance.
In the example below, this Weekly Peaking Ratio is approximately 24-25%.
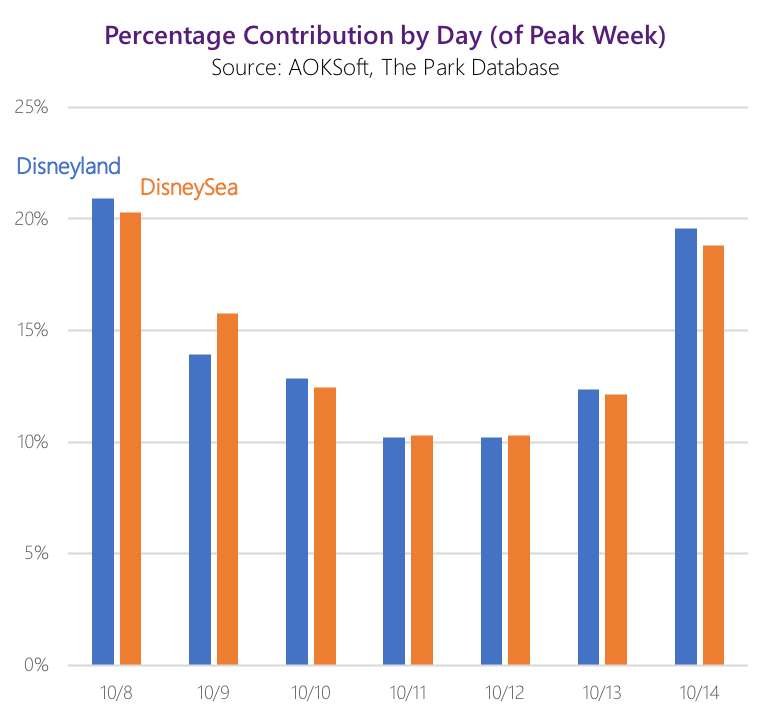
Daily Peaking
Calculate the likely highest attended day of the highest attended week, based on patterns of seasonality. This would usually fall on a Saturday or Sunday, and can be quite pronounced, with up to twice the visitation of a typical weekday.
In the example below, this ratio is 20-21% for October 8th – and exactly double that of October 11th.
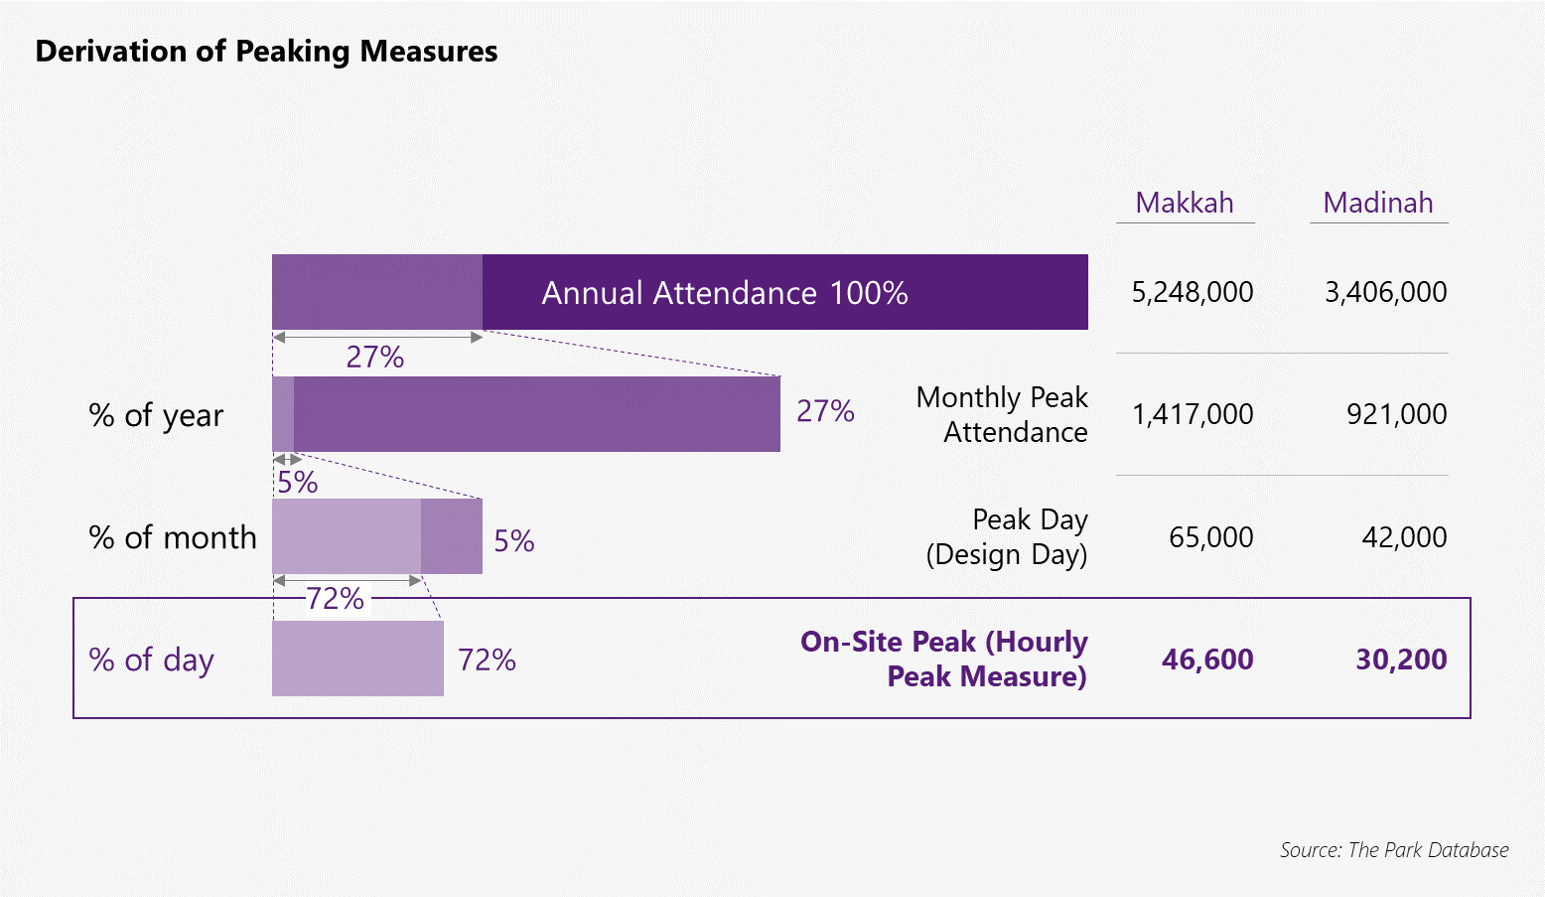
Combine all the previous measures together, and we arrive at the Design Day. Essentially, a Design Day is an “average peak day”. Deriving it is using progressively more granular measures of seasonality, as in the below example.
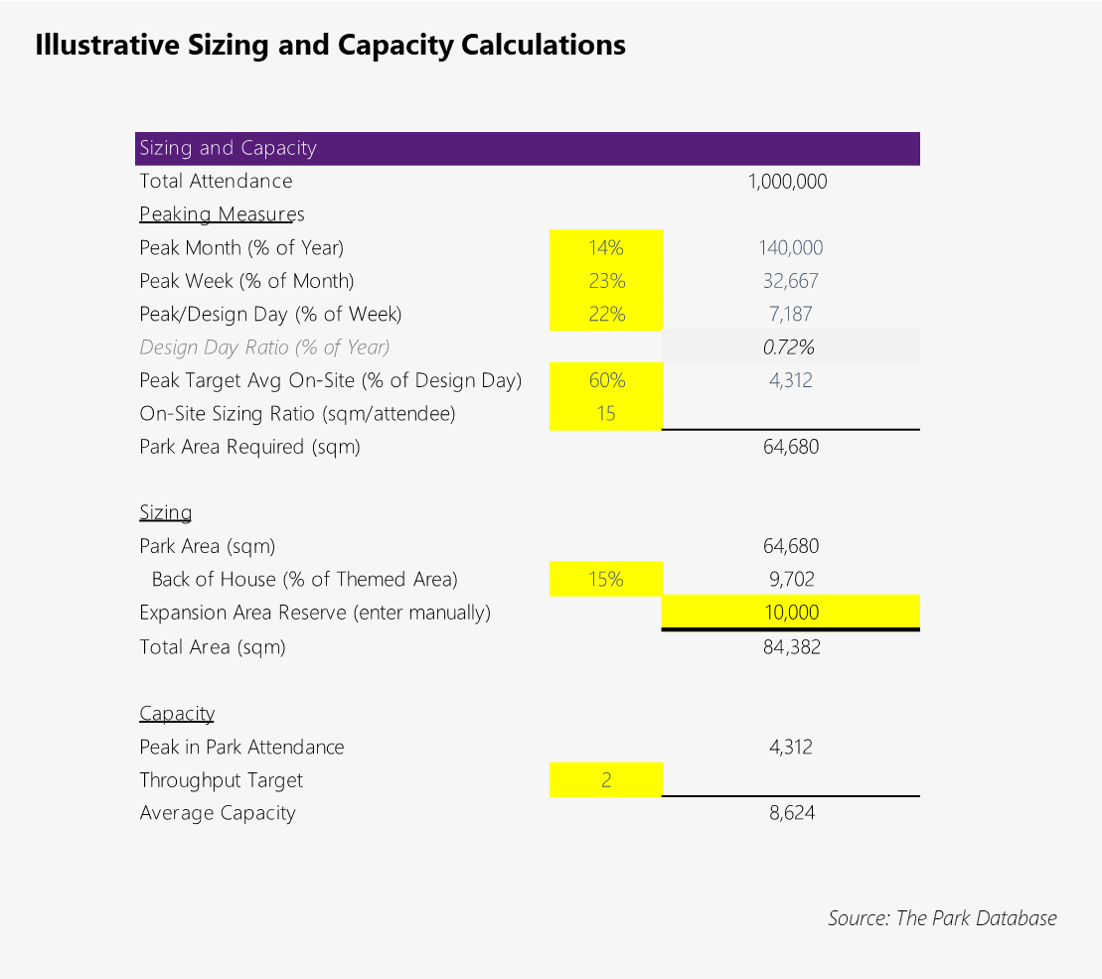
Note that in this example, prepared for an engagement in Saudi Arabia, does not use a Weekly Peaking estimate, and jumps directly from Monthly to Daily Peaking. The last row in the example is Hourly Peak Visitation.
Design day ratios for existing parks usually range from 0.3% to above 1%, which is quite a large range. Major outdoor parks see design day ratios around 0.6-0.8%, as is the case in Japan and China. Waterparks, with seasons that can be as short as 3 months, may see design day ratios of over 2%.
Finally, it’s important to note that this concept is an evolving one, and in recent years has struggled to deal with phenomena such as the Golden Week periods in China, where some parks can derive a significant, if not majority portion of their visitation. Namely, the question being, should a park in fact just size to the peak day of Golden Week, if Golden Week accounts for 30-50%+ of attendance?
In Conclusion
Once we’ve arrived at the Design Day, we return to the concept we began with: Hourly Peak Attendance.
As in the previous example and the one below, attendance throughout the operating day is usually not evenly distributed. We see in the below example that intraday peaking is most pronounced during the evening hours.
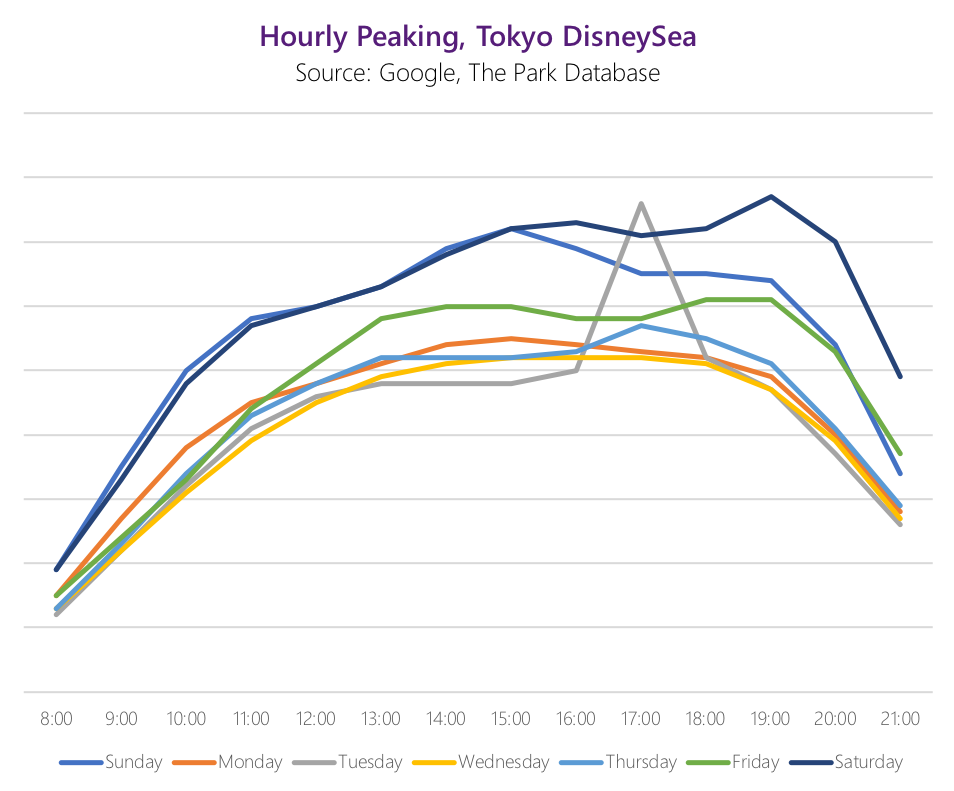
The Hourly Peaking/Peak Onsite visitor ratio is expressed as a % of the Design Day attendance, and usually ranges from 40-65%.
The chart below is what it looks like when we take all the seasonality and peaking ratios derived previously, and combine them. For a real-life example, be sure to check out our post on the seasonality of the Tokyo Disney Resort.
Note, however, that the sizing exercise is not quite complete yet!
After all, what is the size that we’ve just derived? If we’ve taken a Sizing Ratio and applied it to an Onsite Peak Attendance, what we’ve calculated is the size appropriate for guests at the park’s most crowded time.
But a park is comprised of more than just the areas where guests engage in an attraction’s experiences. There’s back-of-house and potential expansion areas to account for. Not to mention food and beverage, merchandising areas, restrooms, and perhaps most importantly – parking.
These are all subjects for a future post, so stay tuned.
P.S., Capacity
With that, we’re done with sizing.
However, sizing is only one issue out of the two major planning metrics.
The other is capacity.
After all, it’s one thing to design a large space to accommodate all your guests, but what are they going to do there?
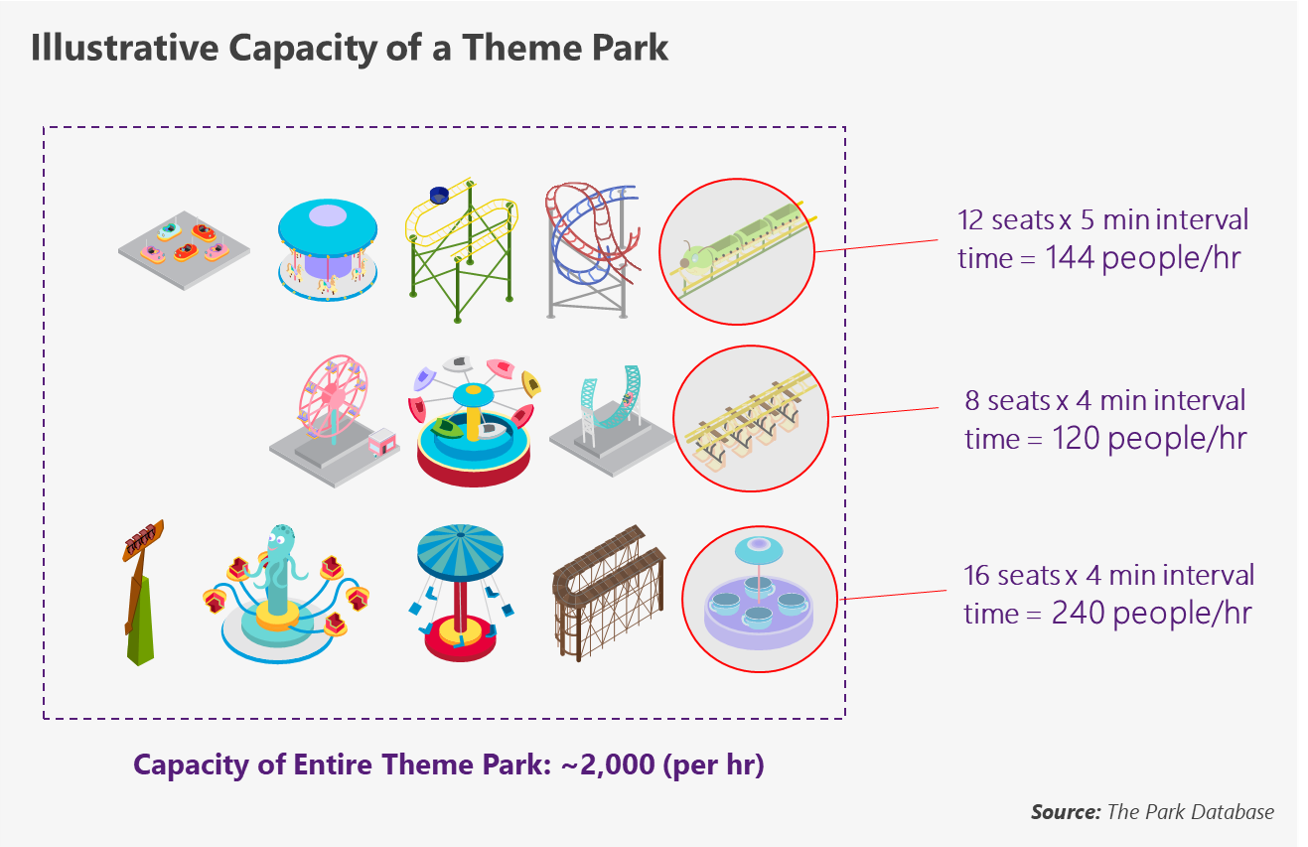
Capacity, also referred to as Throughput, Throughput Capacity, Theoretical Hourly Capacity, etc., is the measurement of the number of experiences that a standalone attraction or entire theme park can deliver per hour.
For example, a roller coaster operating a single train at intervals of 4 minutes (including loading/unloading) might accommodate between 120 to 240 people per hour. That’s 240 units of capacity being delivered by this attraction.
Sum up the individual capacity figures for every ride, experience, show, and exhibit in the park, and you have the theme park’s capacity. Note that capacity is measured in units per hour.
So how does this relate to the number of guests inside the park at any one time? Industry guidelines on the number of experiences that any one guest should, ahem, experience per hour range from 1 to 2. If you’re Disney or Universal you can get away with numbers closer to 1 (or less), but waterparks and other attractions with lower lengths of stay and higher engagement, need at least 2.
This figure is known as the Capacity Ratio, Capacity Target, or Throughput Target, and is multiplied by the Peak Hourly Visitation in order to arrive at the total hourly capacity of the park. This is the average number of experiences that can be delivered per hour to guests at the park.
This is a simple calculation and is illustrated in the bottom rows of the chart above.
Capacity is more flexible than size. Parks can choose to run more cars per track, roll in/out more food kiosks, to run shows with greater or lesser frequency, etc. in order to match the crowd level.
And as with many other issues here, the concept of capacity is fuzzy. After all, what exactly constitutes an experience? There are concrete experiences, like a ride or show, but does an interaction with a food vendor, walking through a themed environment, constitute one?
These are questions better left to the experiential designers, but this analysis at least provides a planning benchmark for the park.
Planning a park? Design day and capacity worksheets and more are available in our model.
Want a quicker, free tool? Check out our free feasibility calculator here.
Alternatively, see the design day concepts in action in our post on Tokyo Disney Resort.
Or read about the design day and attendance characteristics for a few mega Chinese parks here.