Updated as of October 2023.
Encompassing everything from theme parks to zoos, museums to resorts, the attractions industry plays a pivotal role in the global tourism and entertainment sectors.
Our newly unveiled Attraction Investments Tracker is a dedicated effort to collect cost and budget data for every major announced attraction around the world.
Including data from 2017 to the present (October 2023, as of this writing), we’ve collected investment costs for new projects, renovations, relocations, as well as at the individual exhibit or attraction level.
As of this writing, we’ve collected over 2,800 records from 70 countries and more than a dozen attraction types. By delving deep into the data from the last several years, we aim to offer stakeholders—from industry leaders to enthusiasts—an unparalleled tool for benchmarking and analysis.
What follows below are our findings.
For a general overview of development costs, and the theory behind them, see our Business of Theme Parks: How Much Do They Cost? article.
Key Insights from Recent Projects
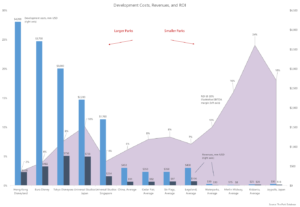
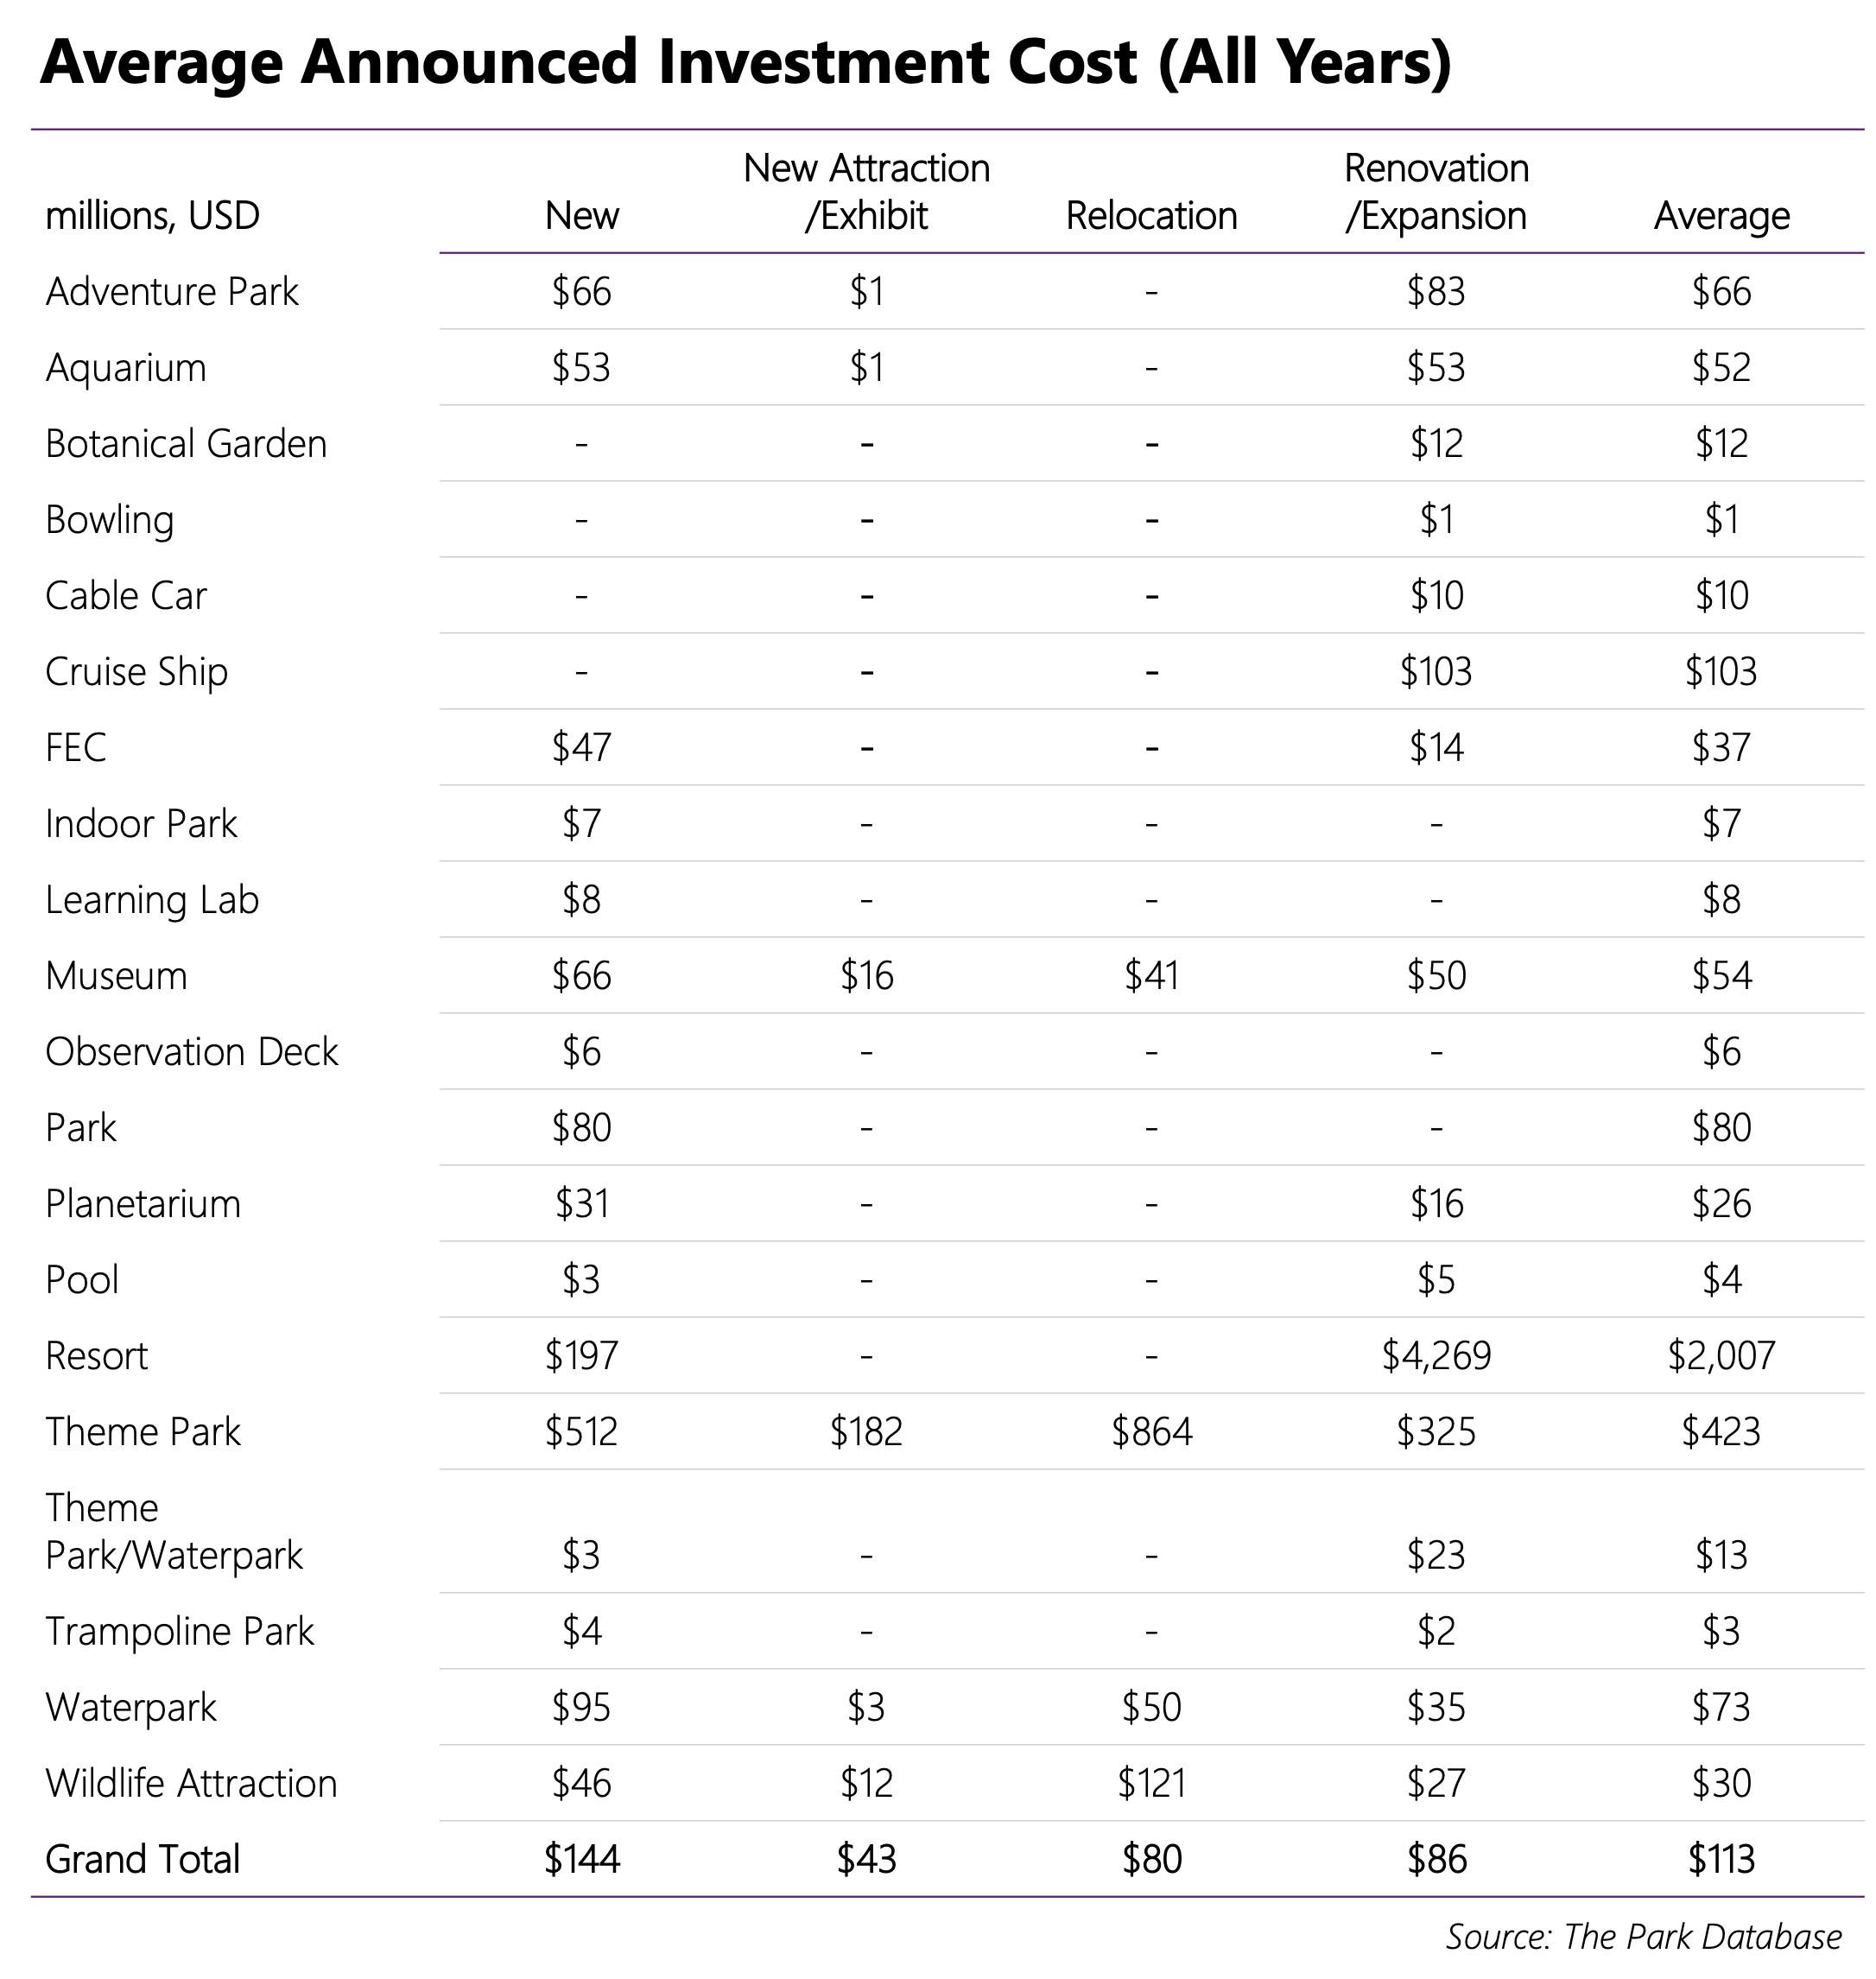
1. Average Project Costs (2017-2023):
- Adventure Park: $66.5 million
- Aquarium: $51.9 million
- FEC: $36.8 million
- Museum: $54.1 million
- Theme Park: $422.7 million
- Waterpark: $73.3 million
- Wildlife Attraction: $29.6 million
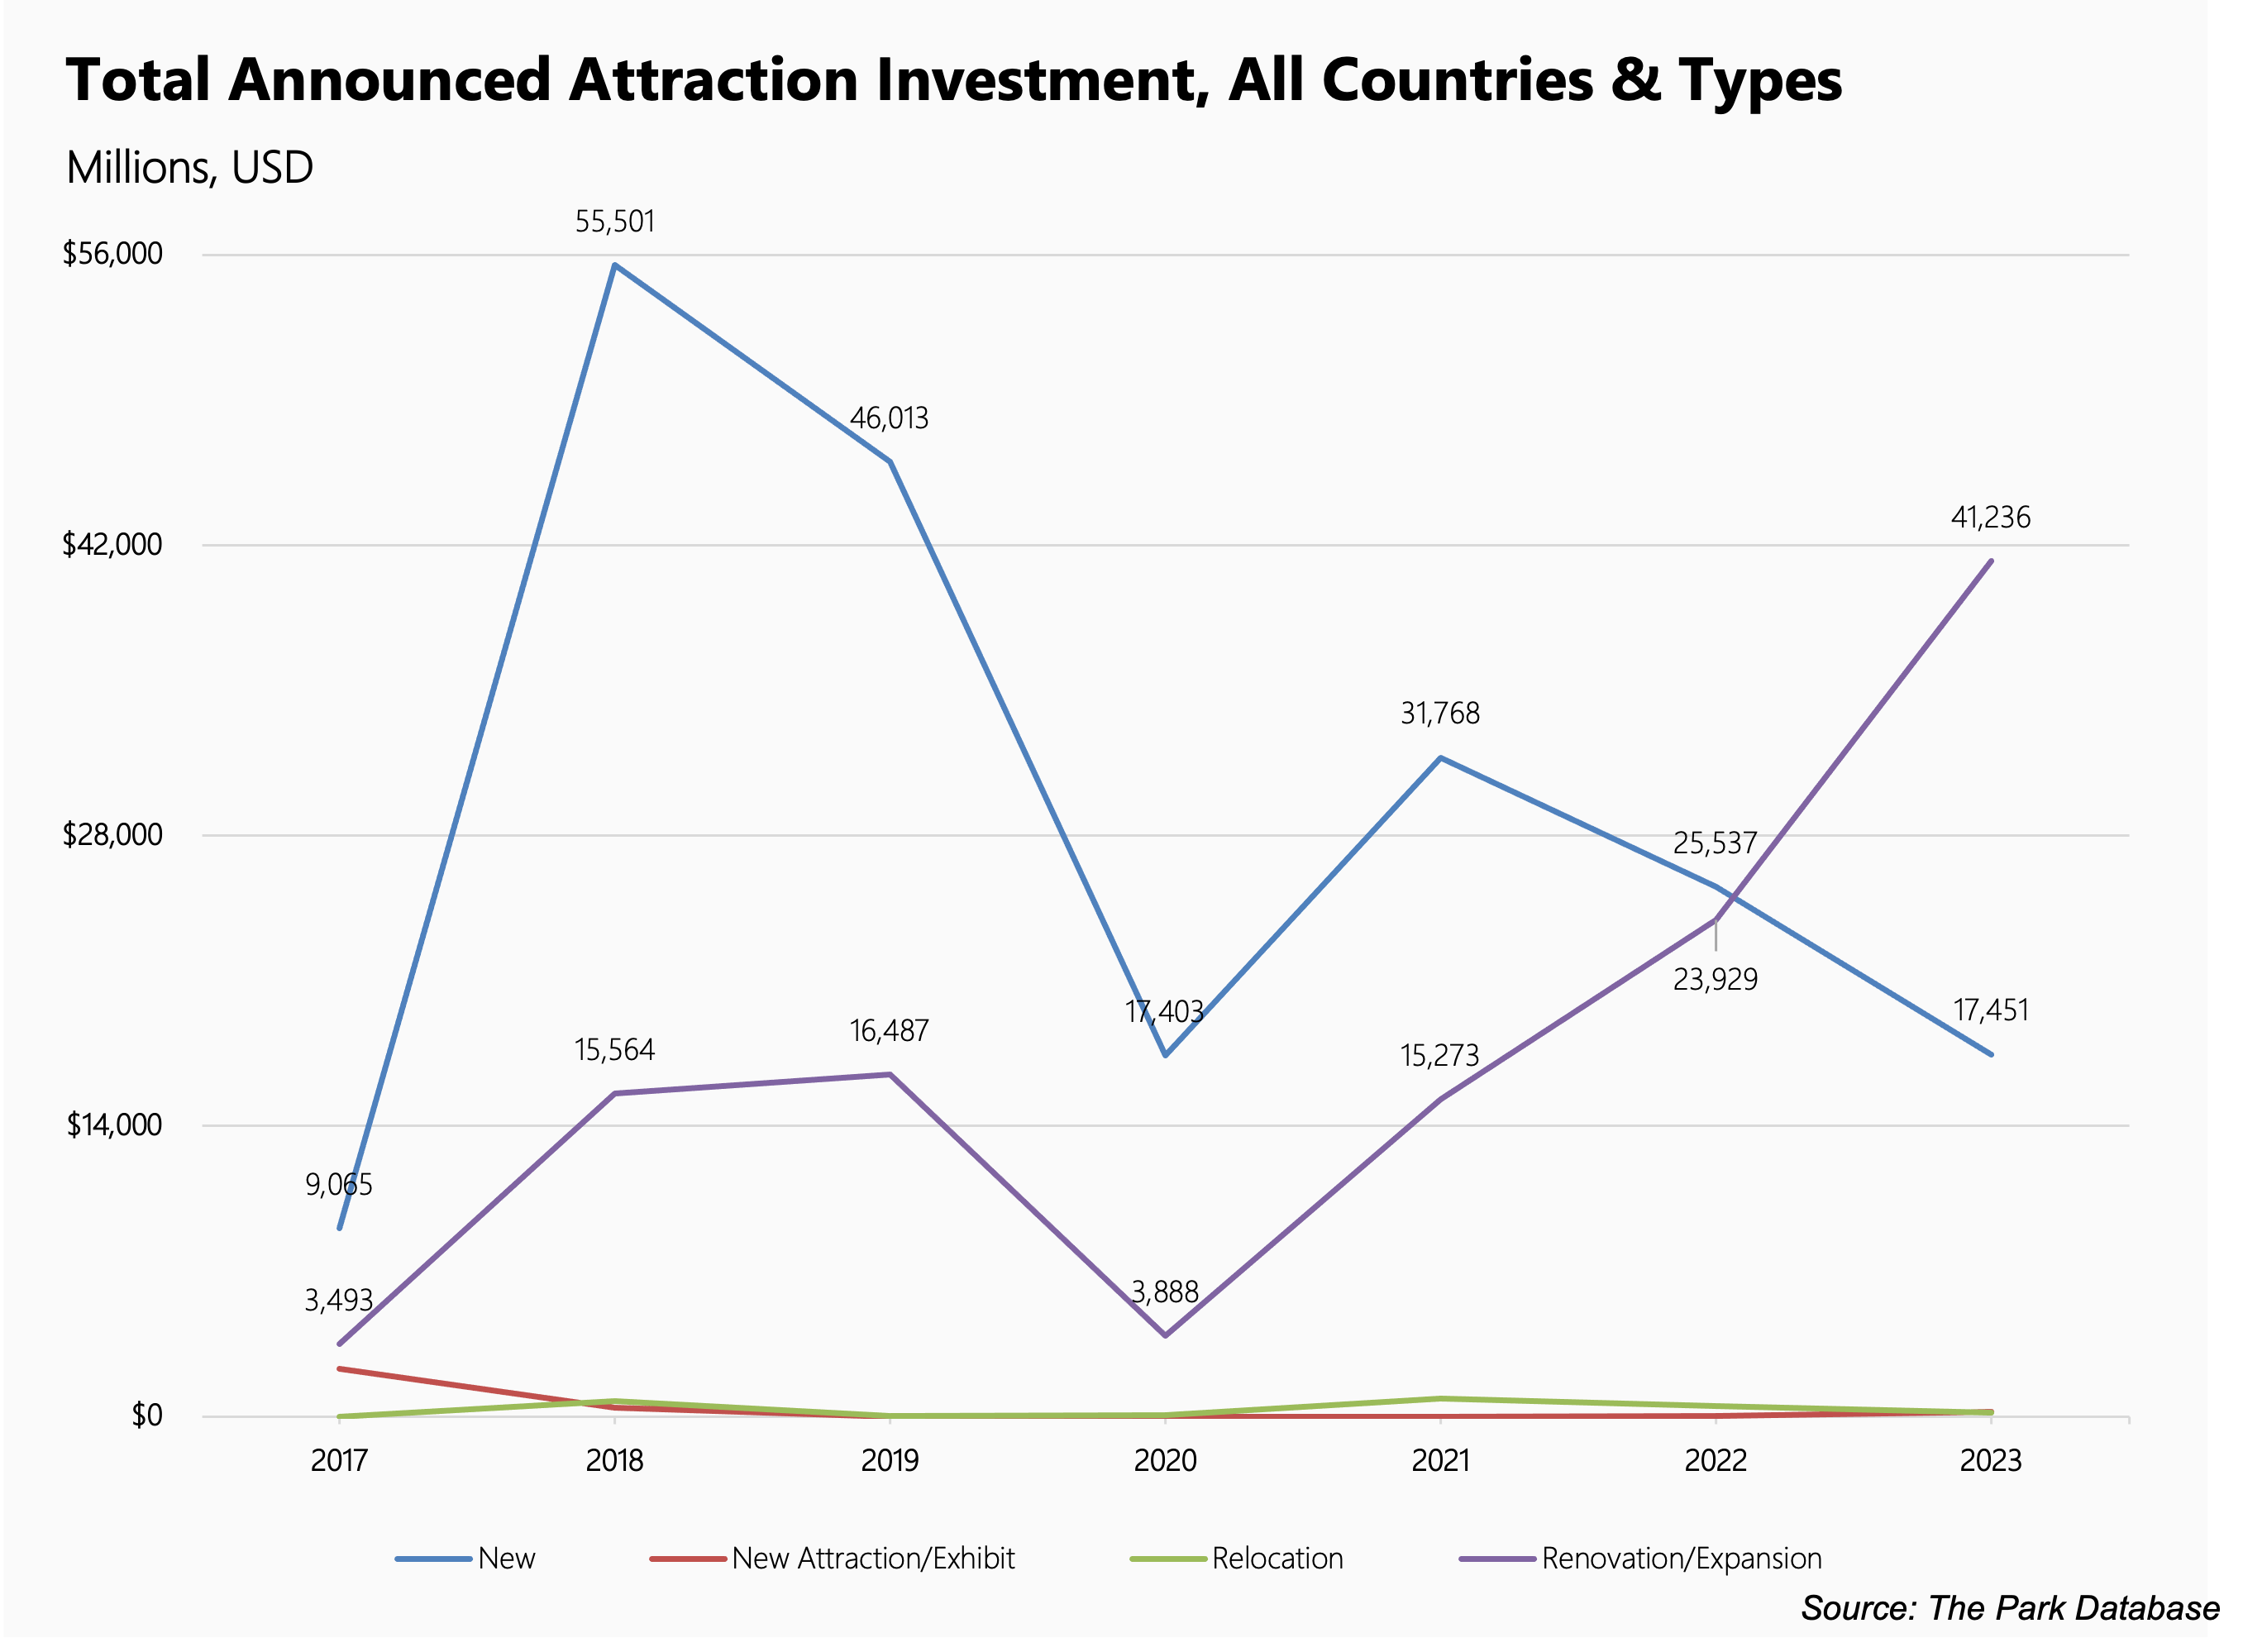
2. Total Tracked Project Costs (2017-2023):
- 2017: $14.8 billion
- 2018: $72.2 billion
- 2019: $62.5 billion
- 2020: $21.4 billion
- 2021: $47.9 billion
- 2022: $50 billion
- 2023: $59.1 billion (as of October)
3. Project Types:
New projects, understandably, demand the most significant investments, with an average cost of $144 million between the period 2017 and 2023. However, renovation and expansion projects, with an average price tag of $86 million, are also notable investments.
Post-Pandemic Recovery:
While the events of 2020 cast uncertainty across the attractions landscape, the industry has shown a remarkable resilience and recovery.
By 2021, a surge in project counts was evident, with 470 new ventures, up from a count of 285 in 2020. Not only did the number of projects rise, but the average investment also soared to approximately $101.9 million, from $74.9 million the previous year. We tracked a total of $47.9 billion in cumulative project announcements in 2021, up from $21.4 billion the previous year.
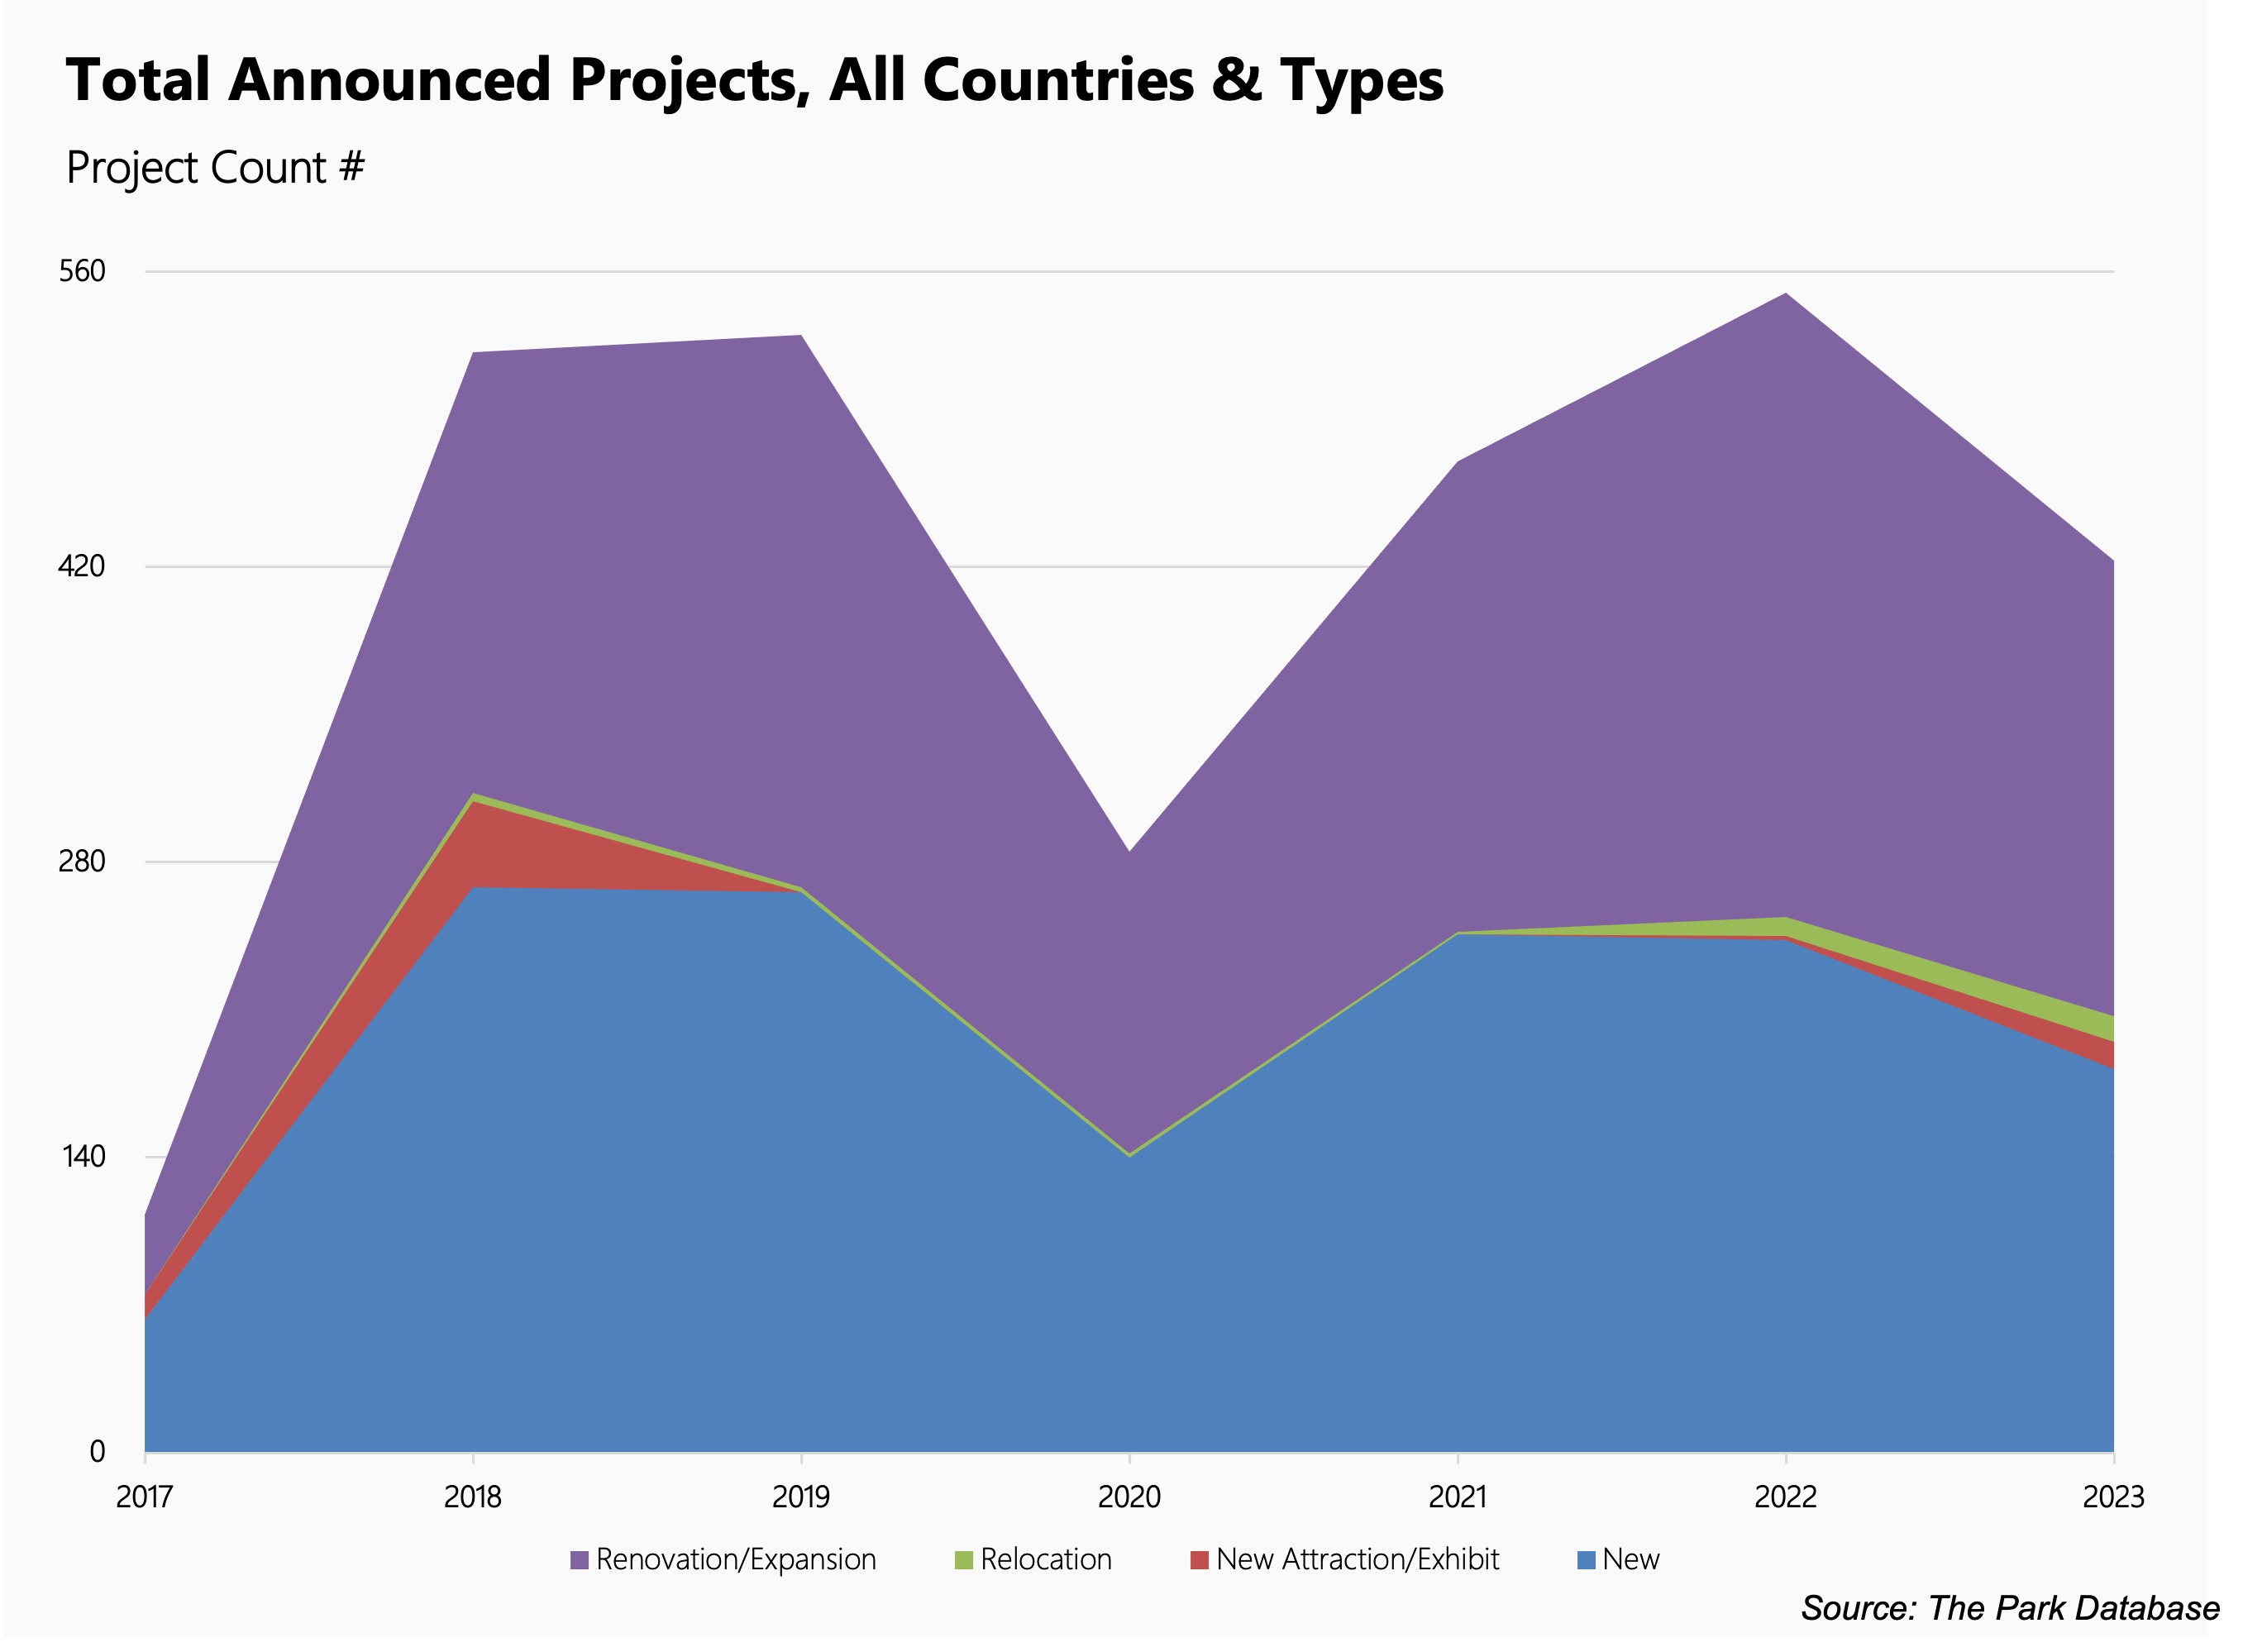
The momentum continued in 2022, as project counts reached 550, with average and total investment levels nearly consistent from the year earlier.
2023 has shown a recovery along some metrics to nearly pre-pandemic levels. Average investment per project tracked this year (2023) are approximately $140 million, in line with a figure of $138 million in 2018. Total announced investments of $50 billion (as of October) are nearly triple that of 2020 levels, but still below the $60-70 billion range of 2018 and 2019.
Geographic Trends:
The influence of geography on project costs is undeniable. Countries such as Qatar, Saudi Arabia, and China, which feature high average project costs, are often at the forefront of infrastructural and touristic development, investing heavily in the attractions industry as a part of a broader economic diversification strategy.
In the Middle East, mega-projects are not just about attracting tourists; they’re about crafting a national identity and showcasing cultural heritage to a global audience.
Elsewhere, a rise in project costs can be attributed to a burgeoning middle class with increased disposable income, eager for quality entertainment options. The result? A surge in theme parks, resorts, and other attractions aiming to cater to this vast market.
The Value of Renewal:
The data showcases the significant investment that goes into renovation and expansion projects. It reflects the truth that the attractions industry is as much about reinvention as it is about innovation: in most years, the number of announced renovation and expansion projects outnumbered the new ones.
As visitor expectations evolve, what was cutting-edge a decade ago might now seem outdated. Attractions need to continually refresh their offerings to meet contemporary standards and preferences, ensuring they provide experiences that resonate with today’s audience. Renewal can breathe new life into older attractions and further increase their lifespan.
Niche Attractions:
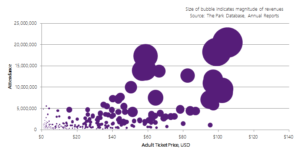
While the allure of mega-projects like expansive resorts and sprawling theme parks is undeniable, the data also highlights the industry’s diverse nature. Aquariums, botanical gardens, and other niche attractions command a significant share of investment, pointing to varied visitor interests.
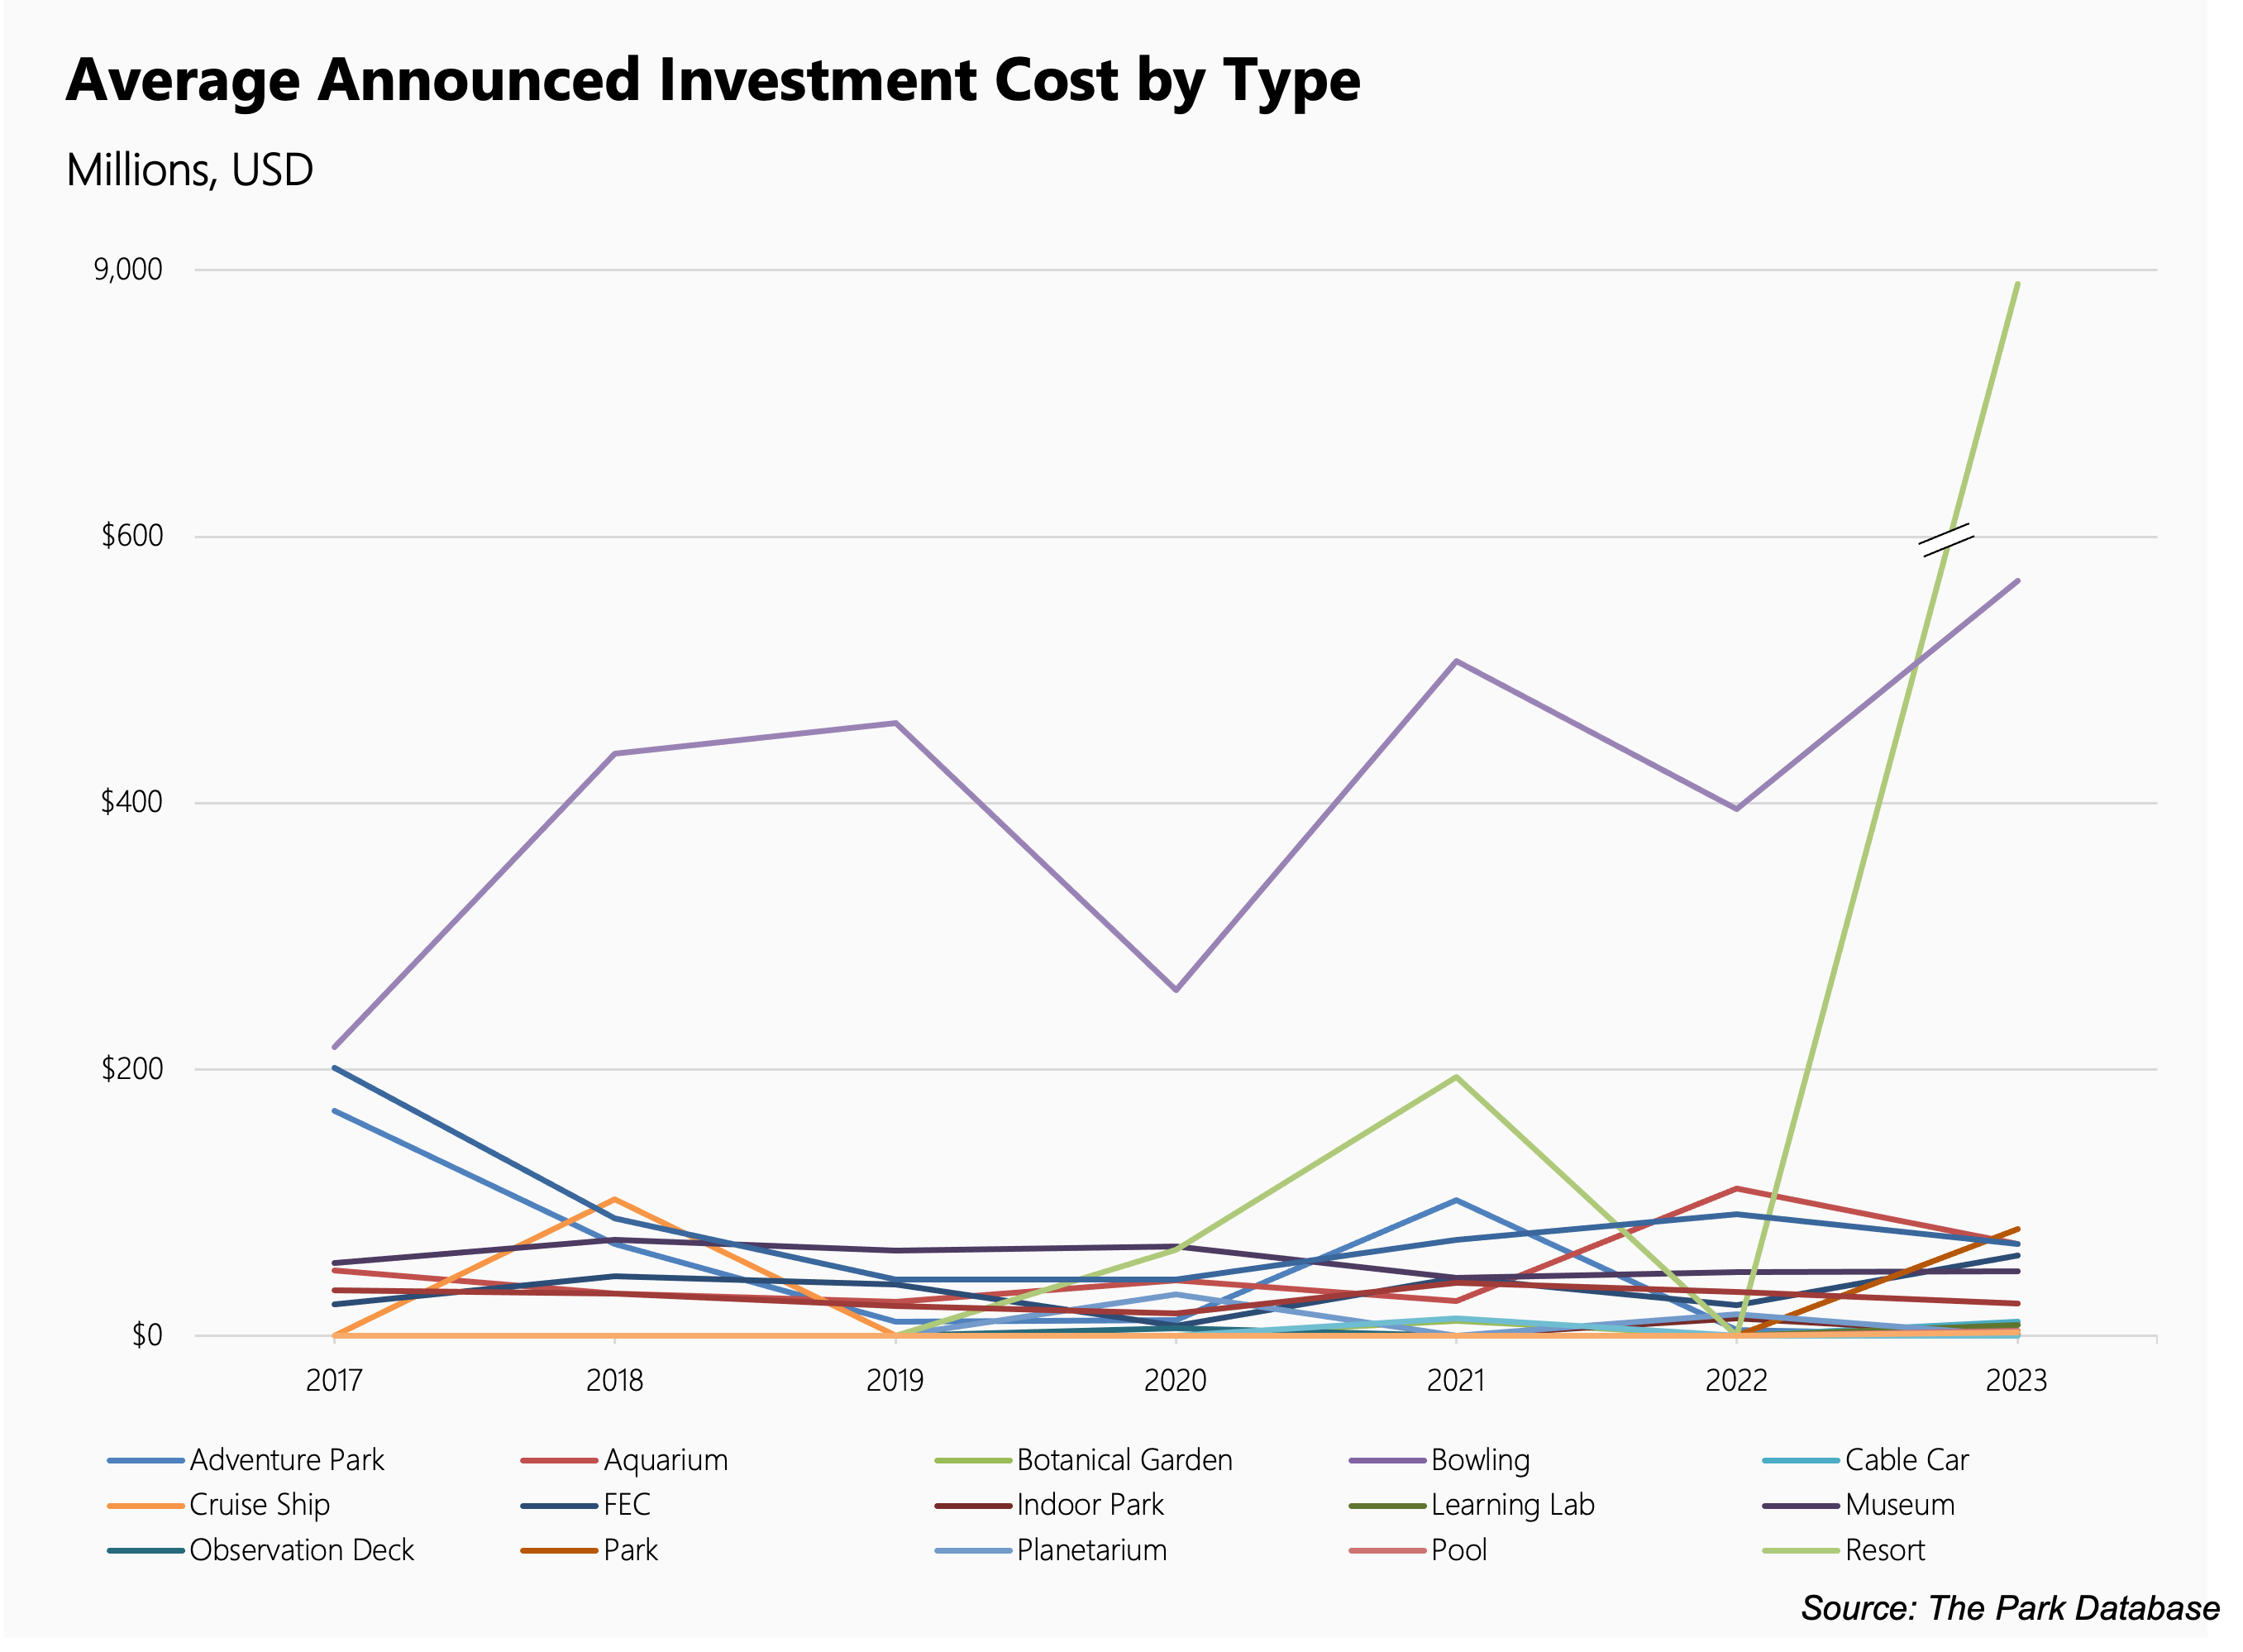
Against a tracked 2023 investment total of $22 billion for theme parks, a total of $8 billion is seen for waterparks, and $6 billion for museums. Aquariums and FEC budgets account for another cumulative $4 billion.
Not every attraction needs to offer adrenaline-pumping roller coasters or expansive themed lands. A wide range of audiences exists in every market, looking for specialized experiences that align with their interests.
Concluding Thoughts
Especially in the post-COVID era, our research underscores the resilience and enduring optimism of the attractions industry. With billions of dollars invested across countries and attraction types, it’s evident that the demand for high-quality leisure and entertainment experiences remains robust.
For industry stakeholders, researchers, and observers, this data will prove to be a valuable benchmarking tool, and fertile source for analysis.
For more details, and access to the full data download, you may purchase the entire database of more than 2,800 records here.