We have a love-hate relationship with penetration rates.
As you might be aware, penetration rate methodology is the predominant method used to forecast attendance at theme parks, and conduct feasibility studies in the attractions field.
But, it suffers from almost anything you can imagine about a quantitative method: it’s imprecise, has no standard definition among almost everyone who uses it, and upon careful reflection, you’ll realize that it’s…not a forecasting tool.
Before we get into what it’s not, let’s review what a penetration rate analysis actually is.
Simply, a penetration rate is a measurement, and is used widely in various industries to determine what percentage of a population, or market, has access to a device, attends an attraction, or exhibits some sort of behavior.
- For example, an analyst might look at the market penetration of smartphones in China.
- Or the market penetration of Coca-Cola or Starbucks in Africa.
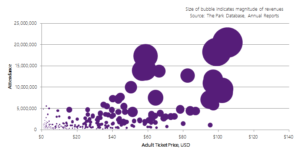
- In the attractions industry, Economics Research Associates (ERA) applied the use of penetration rates to determine the ratio between the total market size, and actual visitation.
A Micro-History of Penetration Rates
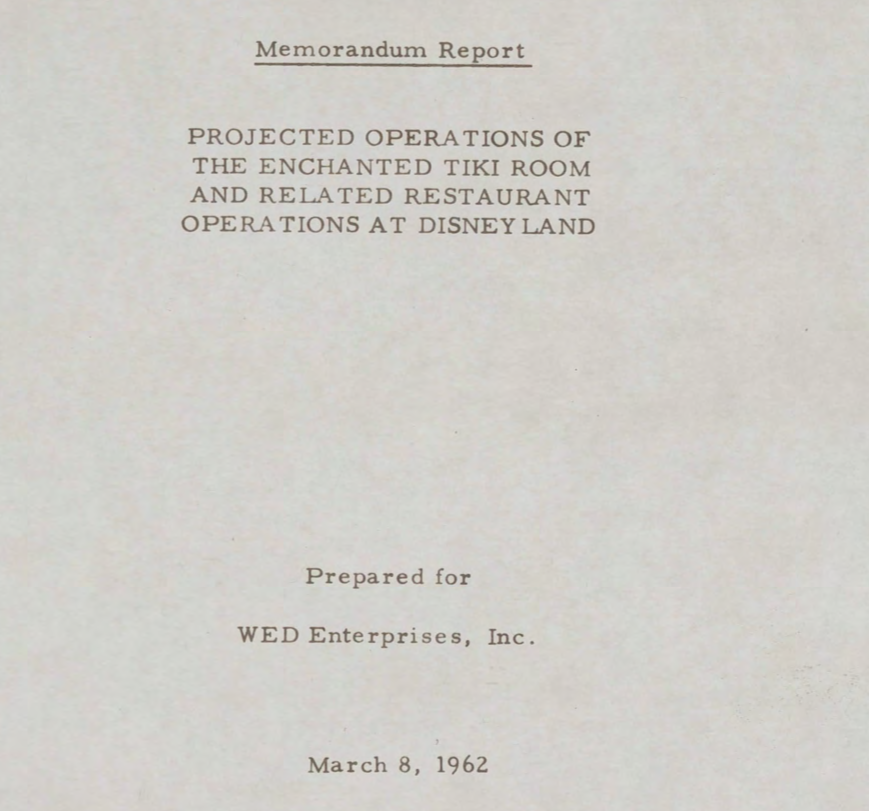
To make this more clear, let’s take a look at an actual study conducted in the mid-1960s by Buzz Price, founder of ERA.
Here you notice that in advising MCA Inc., on the market potential of what would later become Universal Citywalk Hollywood, Buzz illustrates the penetration rates required to achieve a certain level of sales:
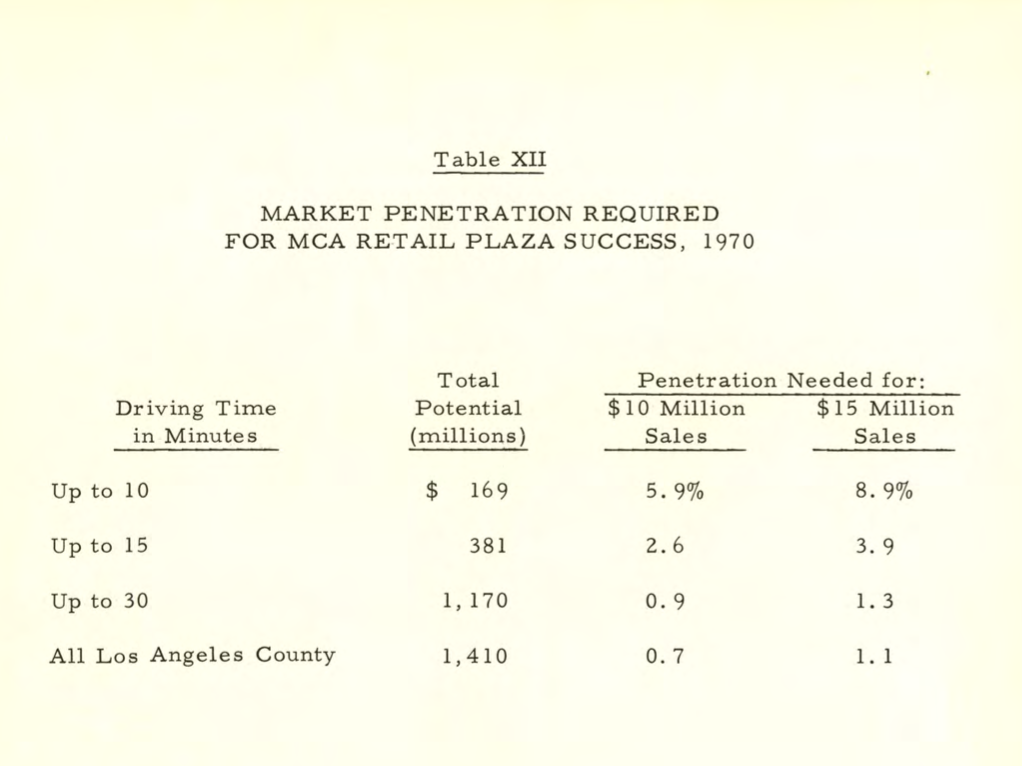
Note that penetration rates are not driving the analysis. The market potential is shown. Some reasonable estimates for sales are shown ($10m and $15m). Penetration rates are then calculated afterwards to show what % of the market needs to be captured to achieve those sales.
As the decades rolled on, notice the subtle shift in how penetration rates become used. By the early 1990s, Buzz Price begins using pen rates to drive the analysis instead.
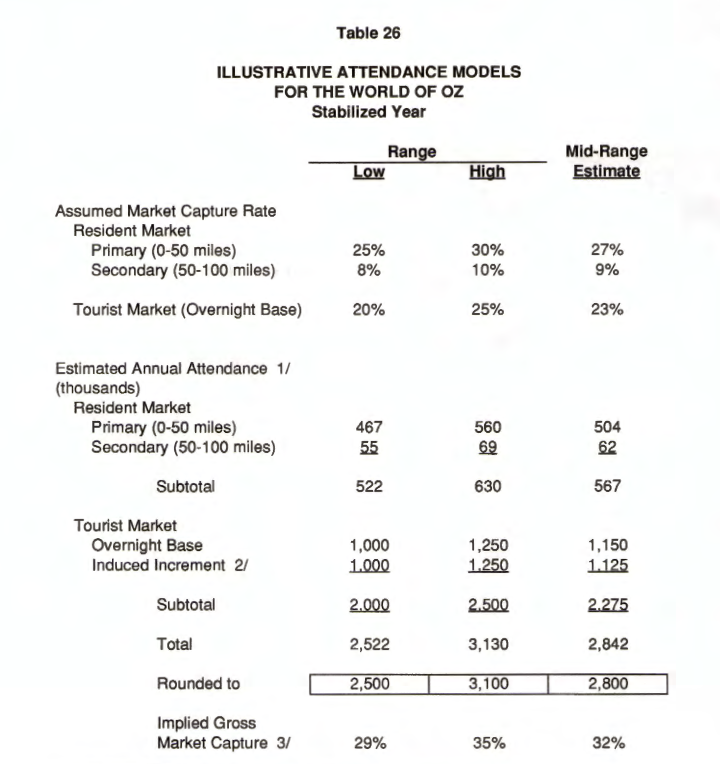
Instead of pen rates being the result, they’re the actual methodology! Penetration rates are multiplied by the market size to determine the estimated annual attendance.
But still, here in the early 1990s, you may or may not notice that this analysis is qualified by the word “illustrative”. Here are some illustrative penetration rates, and that gets you an illustrative attendance. Here are some visitation numbers that could be achieved.
In the decades since that, however, this “methodology” has evolved even further so that pen rate analysis has now become enshrined (ossified) as The Method to magically forecast the likely or probable attendance.
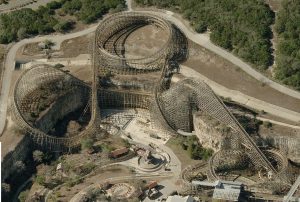
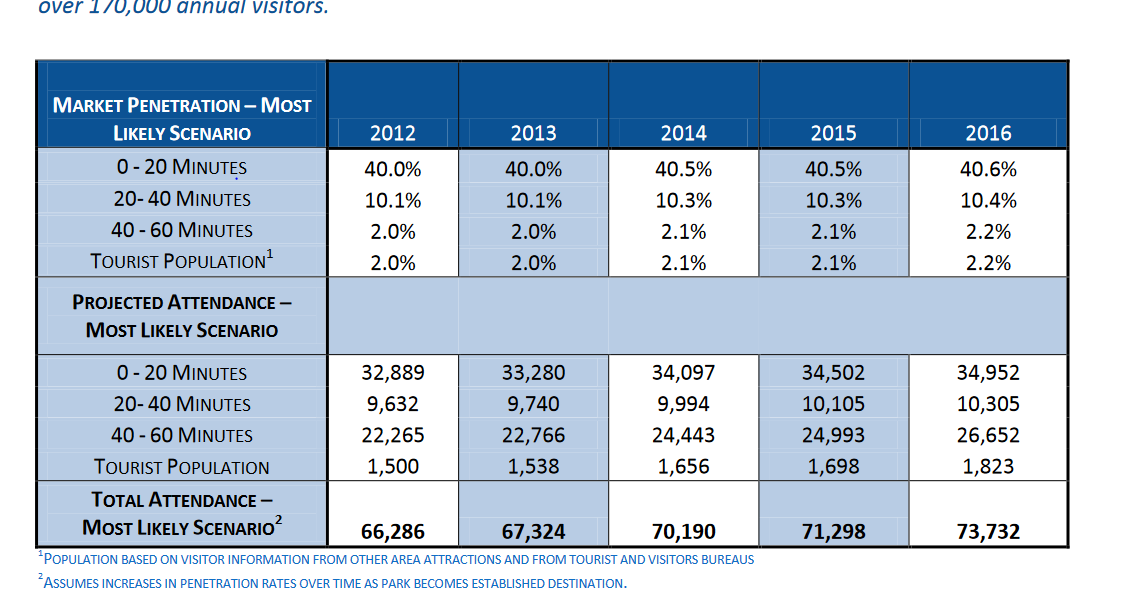
There is no qualification being made anymore, in studies ranging from waterparks in Texas:
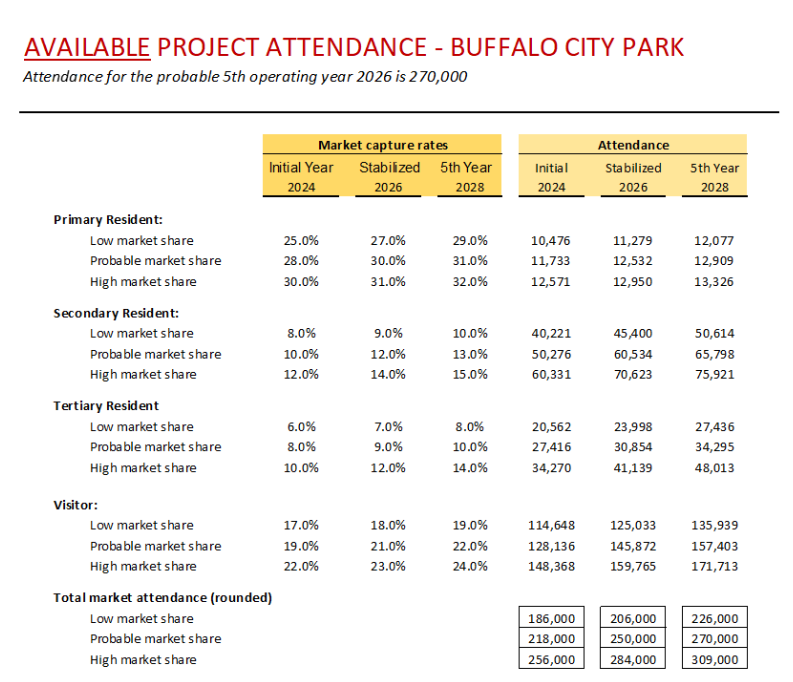
To wildlife parks in Buffalo:
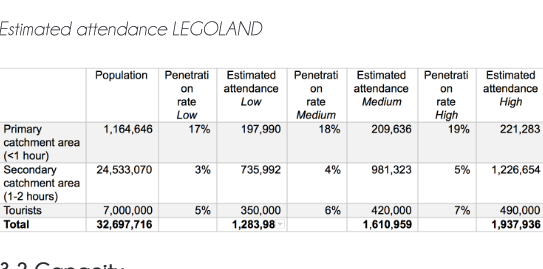
To end-of-term student projects:
So you might be wondering then, where do these magical penetration rate numbers come from?
In any of the above studies, one simply does not know. There is no description of the methodology, or peek behind the magic curtain. The penetration rates drop in like words of wisdom, from the minds of the consultants (or students) who wrote the feasibility studies.
This accords with much of our experience reviewing feasibility studies from around the world. This, the pivotal piece of an attendance analysis, which drives what are usually hundred million dollar to multi-billion dollar developments, are as ethereal as pixie dust.
Moreover, even if illustrative penetration rates from comparable parks are shown, there’s no standard analysis that goes from the “illustrative” to the forecast.
Simply put, this “methodology” has no standard among consultants, often lacks any justification, suffers from a dearth of evidence, and is about as rigorous an analysis as taking two numbers at random and multiplying them together.
What’s the Point?
And so you might ask, what use are penetration rates then?
Well, it’s been a standard methodology for so long that it’s entrenched. And there is readily available data that allows anyone to calculate their own penetration rates, and reason by analogy accordingly.
Theoretically, there is some merit to the idea that if an existing theme park is capturing the nearby market at [x]% rate, that a newly built park with similar characteristics, would also exhibit a similar penetration rate. We’ll call this the Theory of Penetration Rates, or TOPR.
Makes sense, right?
Except that in practice, things like market dynamics, competition, operating strategies, marketing, and cultural differences have a huge impact.
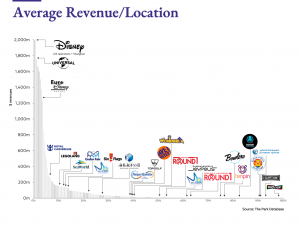
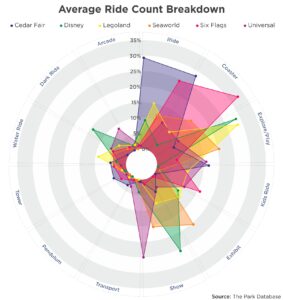
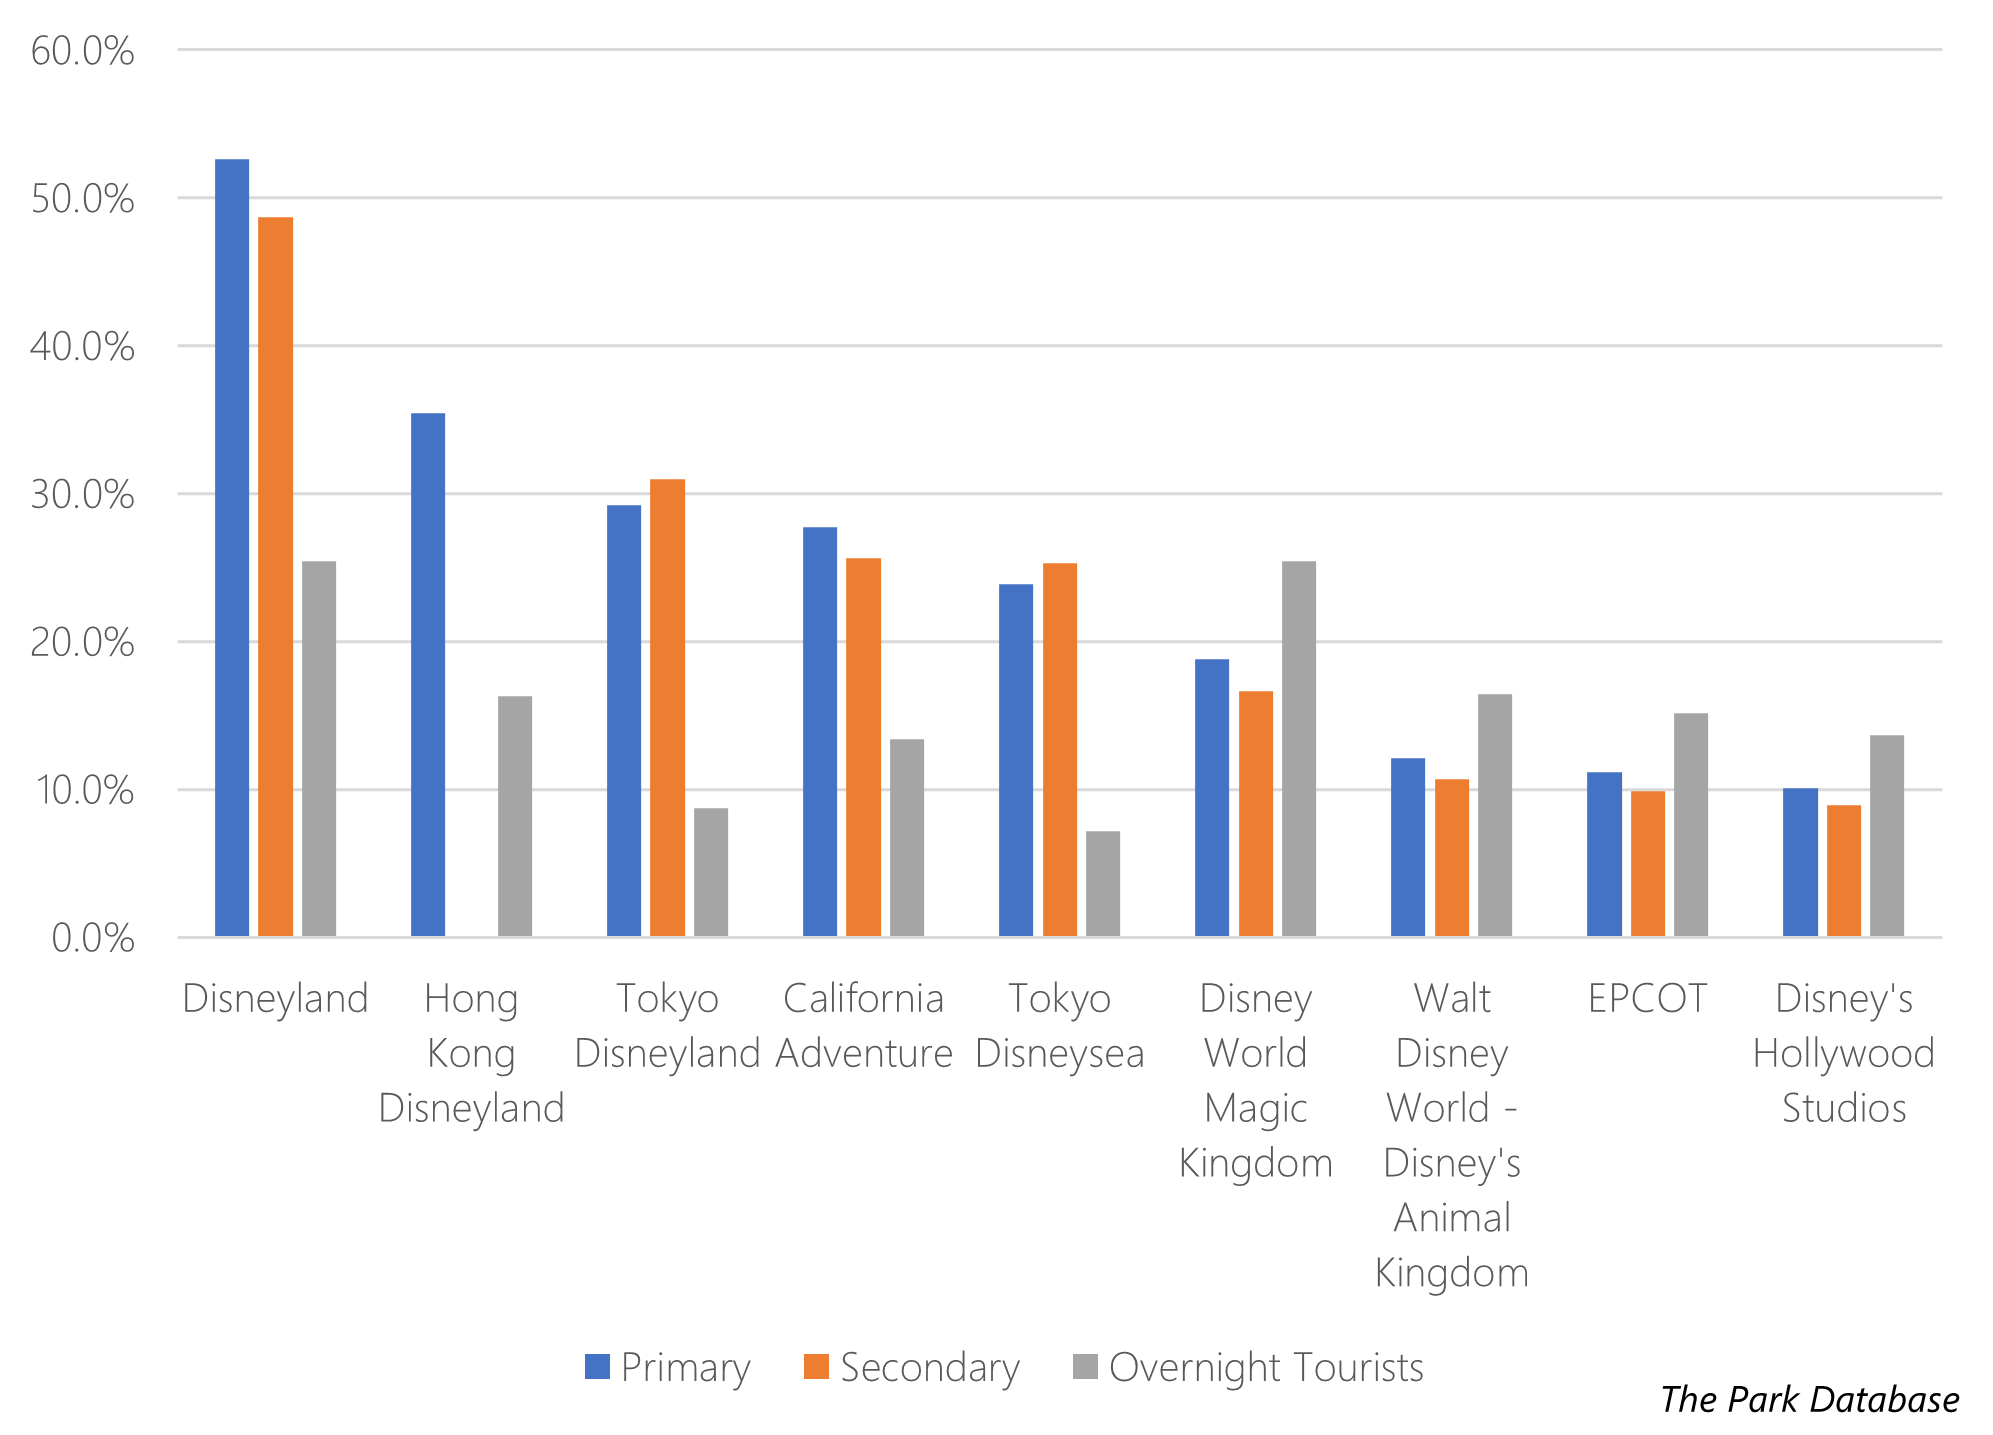
If TOPR actually worked, then you would not expect, say, a Disney park, to show penetration rates that were all over the place, with a huge 400% gap among the highest and lowest rates of the parks from its various geographies.
Which is clearly the case:
Pen rates are not a forecasting tool. They’re a ratio. A measure.
And in the same way that you might look at the price of a home in your neighborhood to determine what yours might be worth, penetration rates work best in reasoning by analogy.
If Park A has penetration rates of [a]%, then New Park might have penetration rates of [a]% x [b], with [b] being some sort of adjustment made for the market, competition, operating factors, etc.
Theoretically, this makes sense too, doesn’t it?
Although, there is no standardization as to how [b] is determined, either, meaning that once again, this “analytic method” is purely illustrative.
In summary: any penetration rate analysis used in attractions feasibility is illustrative.
It shows what “could happen” if an illustrative pen rate from another project is applied.
It is not a forecast!
Anyone using it should be aware of its limitations and conditions. There is no magic tool to forecast attendance of a given attraction.
Forecasting is, despite any financial analyst or consultant’s claims otherwise, nearly impossible.
What’s all this to say?
That the best thing you can do if planning for a theme park, is to approach the business planning with a scenario-type analysis, testing a range of assumptions that seem reasonable. See more here in the summary section. You don’t need to pay a consultant or advisor tens of thousands of dollars to prepare some sort of attendance ‘forecast’ on pro forma.
Also, that in the spirit of dialogue and transparency, that we’re opening up the penetration rates we use. You’ll see them in both our best-selling development model and our benchmark ranges product.
Use them at your own discretion, and remember – anything derived from them are illustrative only.