In the first part of this series, we evaluated the revenue side of theme park business models. In this series, we’ll continue our exploration of the economics of theme parks by reviewing the cost of building amusement and water parks.
More importantly, however, we will be looking at what theme park development costs mean for profitability.
As with the first installment, we’re covering a lot of ground here because we’d like to speak not only to industry insiders, but any other potential developers, investors, or those curious about theme park or amusement park business plans.
Generally, the larger the theme park budget, the lower the probability that the attraction will be project-level profitable.
This means that indoor theme parks and waterparks have the probability for the highest returns, followed by regional and superregional parks.
Lastly, mega parks built by Disney and Universal usually feature the lowest project-level returns.

We define project-level returns as EBITDA profits against total attraction development costs. Indeed, certain positions along the capital stack will see much higher returns based on leverage, the existence of pre-opening funding sources, etc.
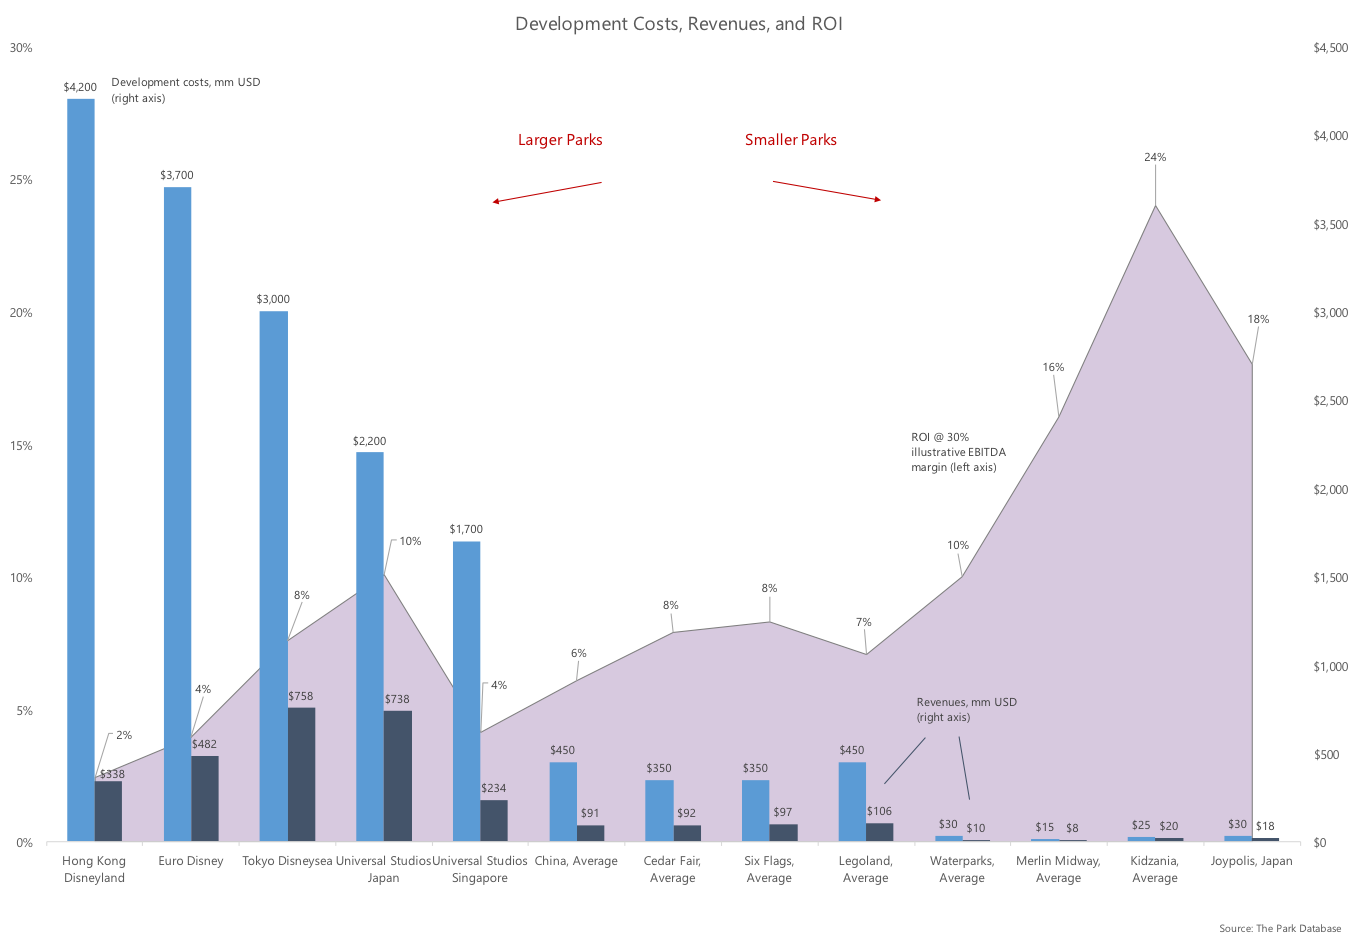
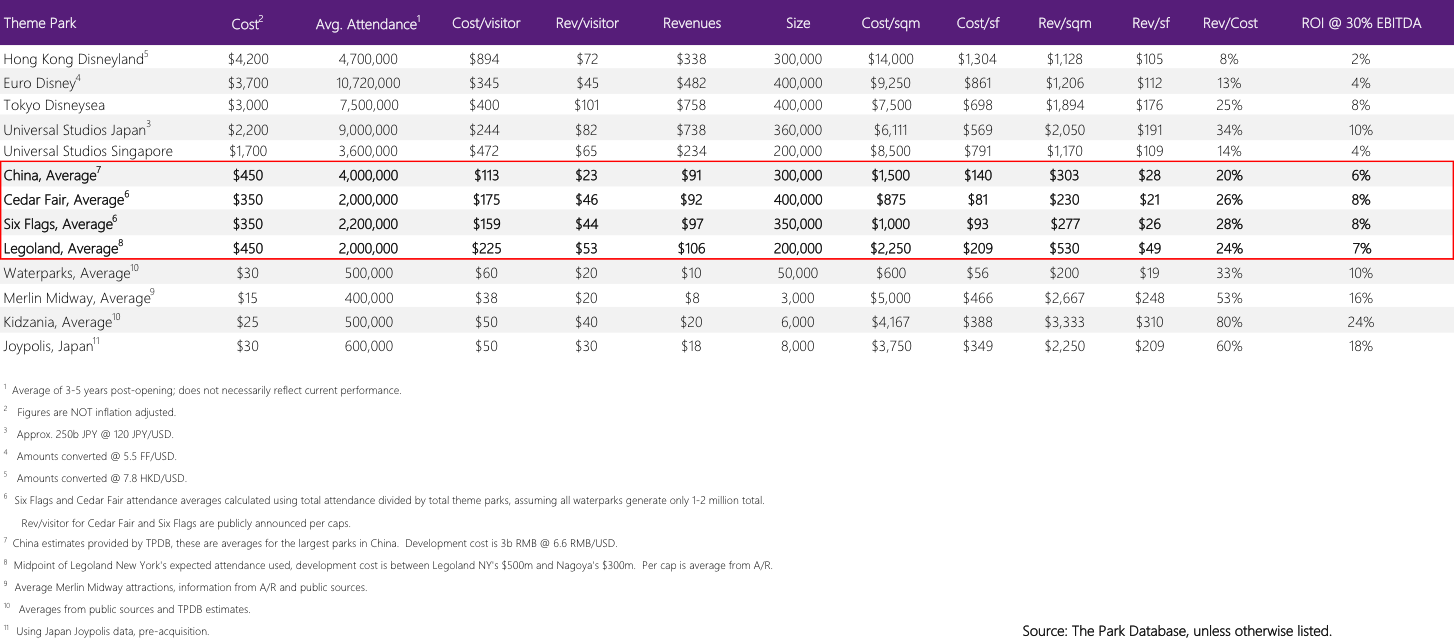
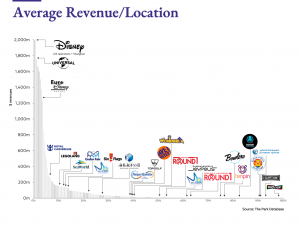
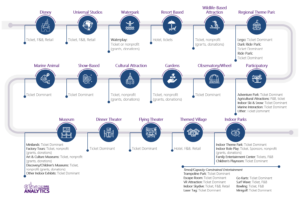
Here’s the dataset we used. Click on any/all pictures for larger versions. The datasets in this and all blog posts use illustrative data from publicly available sources or are internal estimates.
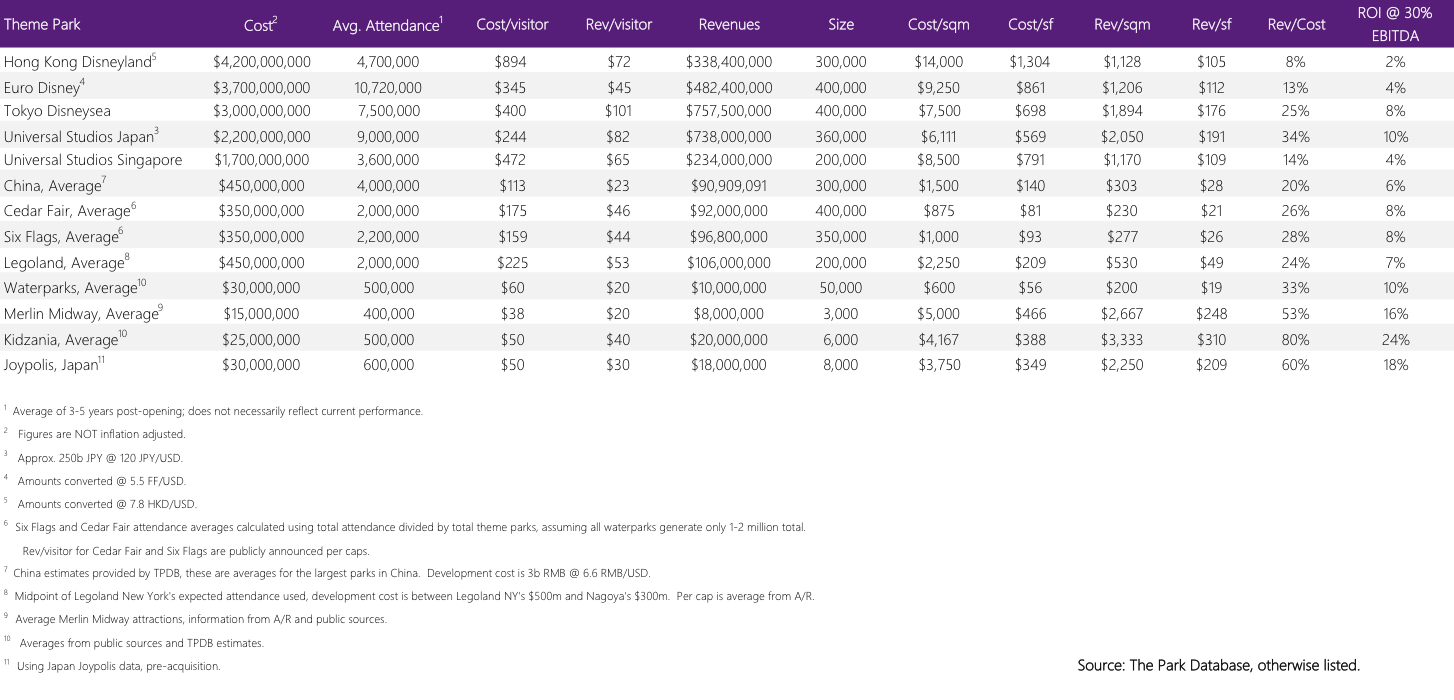
Now, if you literally just clicked into this post to answer the question “how much does it cost to build a theme park or water park”, here you go:
- Mega theme parks; i.e. Disney and Universal: $2b to $4b USD
- Regional and superregional theme parks: $200-$500m USD
- Waterparks: as mentioned in our previous post, a water playground can be constructed for less than $1 million. But most common is between $10-$40m. Anything above $40-$60m is truly aiming high.
- Indoor theme parks: $10-$30m USD. More details in this post.
But, we hope you’ll continue on.
The Mega Parks
Mega parks are the Disney and Universals, costing at least $2b-$3b in order to build, and with cash flow up to $300m in EBITDA.
As we saw in the previous installment, Disney and Universal parks are the only theme parks in the world that are capable of achieving $1b+ in revenues. But in order to do so, they spend accordingly.
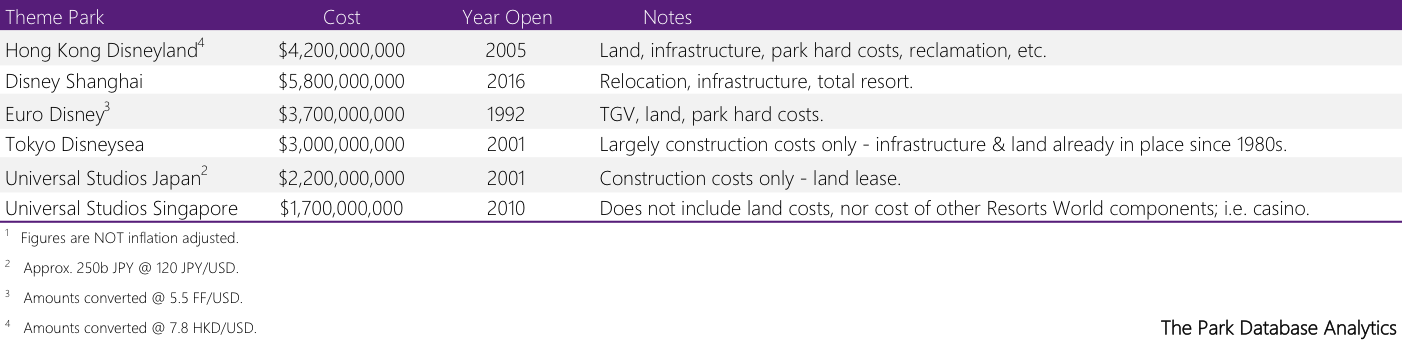
In the past decade, it was a rare Disney/Universal theme park that cost less than $2b-$3b in order to build. If they did, it was because they saved on land costs:
- Universal Studios Japan amortized its land costs in the form of a lease;
- Universal Studios Singapore is part of the larger Resorts World Singapore and did not break out segmented land costs;
- Tokyo DisneySea’s land basis was from the 1960s, when the Oriental Land Company (parent company) acquired land for the original Tokyo Disneyland.
Evidence from publicly-available sources suggests that the profit levels for most recent Disney and Universal projects are in the mid-single digits in terms of rate of return. The reasons are manifold and detailed below. The most important reason is that these parks cost way too much relative to the $$’s they generate.
Why?
Expectations
First, there’s been an inflation in theme park expectations over the past few decades.
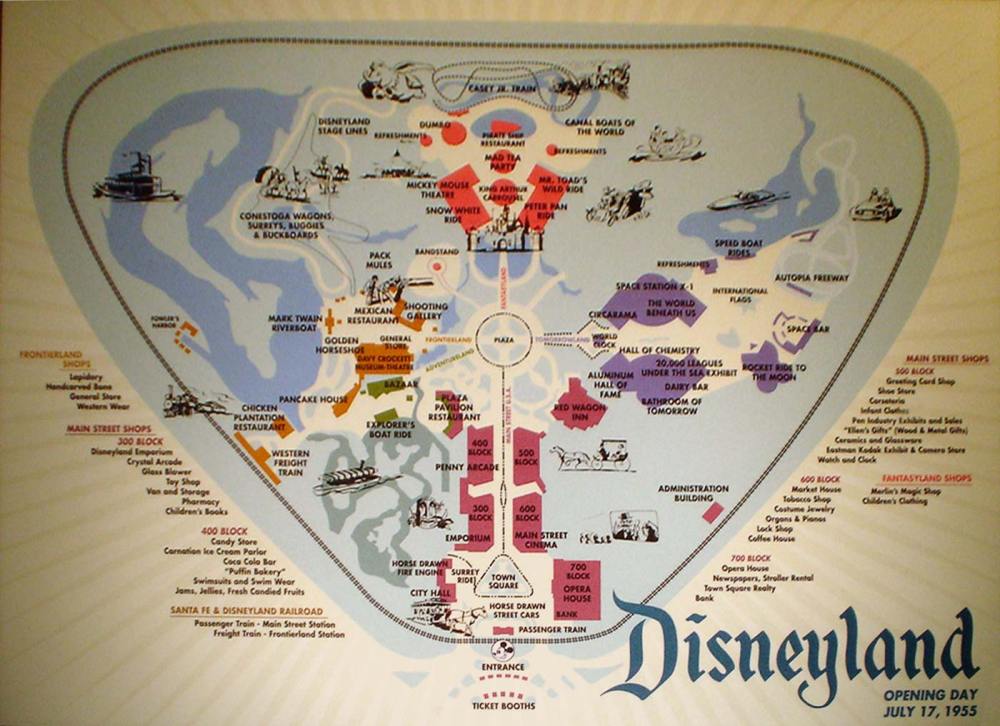
The original Disneyland opened with an attraction mix (~20) that would be considered half-finished today, with a budget of less than $200 million in inflation-adjusted dollars.
These days, Disney and Universal can spend between $30 and $100 million for a single attraction in a park full of $30 to $100 million attractions.
Partially, these theme parks are competing with…themselves in the form of the weight of decades-long accumulated guest expectations about Disney and Universal parks. Partially, these theme parks also compete with the various forms of entertainment that didn’t exist when the first theme parks opened – videogames, internet, social media, cable tv.
The net result is that the threshold for being considered a notable theme park has been raised to such an extent that not only is it impossible for any non-Disney or Universal theme park to compete with the former, but Disney and Universal find it difficult to meet the weight of their own expectations.
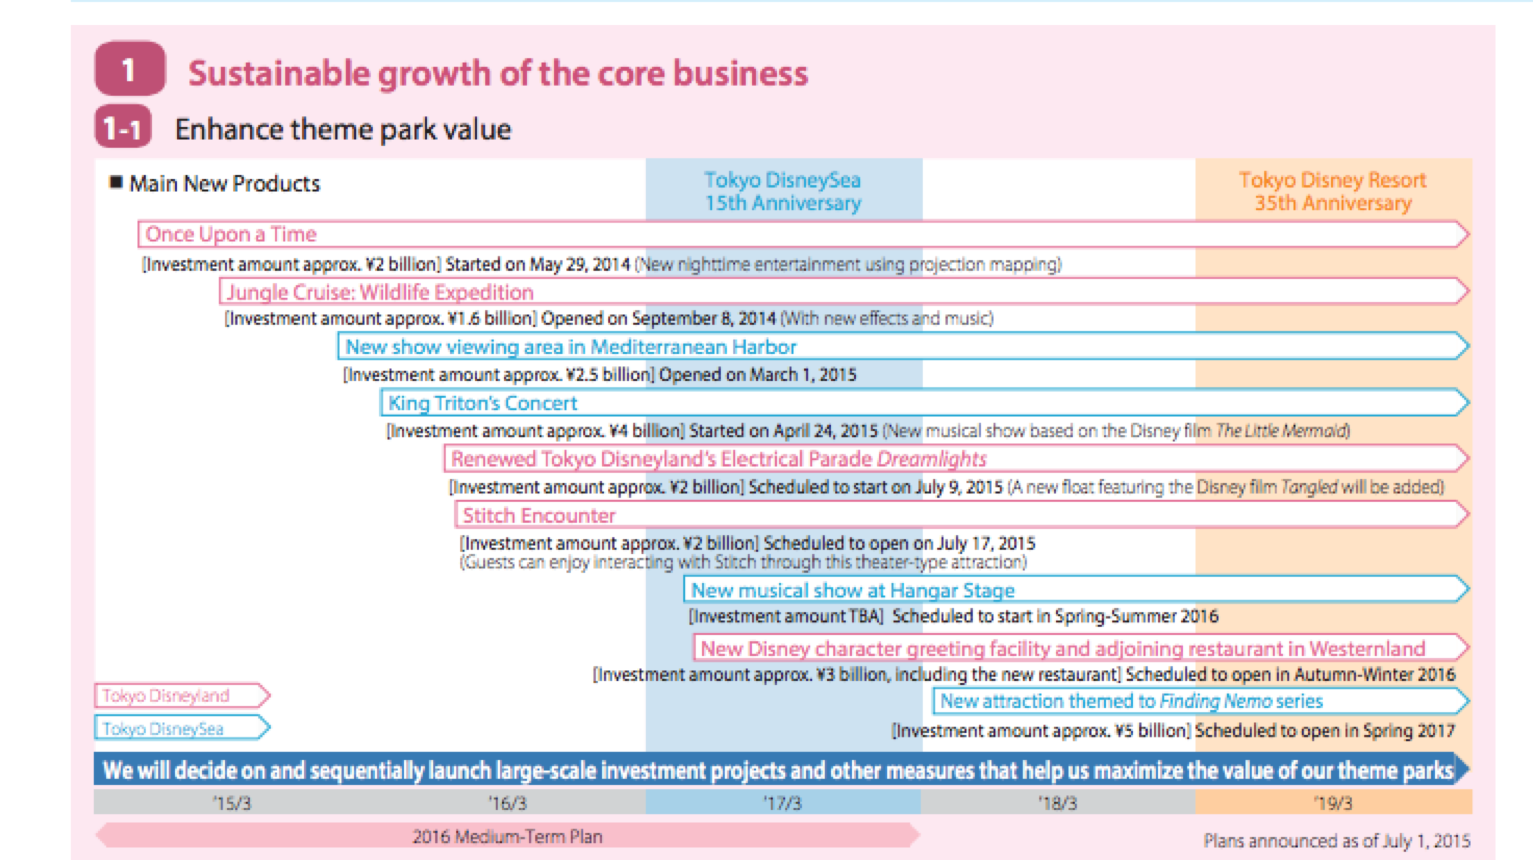
Tokyo Disney Resort is famous for its meticulously, beautifully prepared data books and annual reports. In them, they lay out their future short- and medium-term plans; the above chart is one that was prepared in 2015.
In it you can see that they planned to spend approximately 11 billion yen on each of its two parks over the next five years, which equates to $200 million total: $200 million being, nearly the price tag for a regional ride park.
This is a major reason each subsequent park is getting more expensive to build, because the attraction mix that you need to open with in order to compete with each existing park is stupendous. Universal Studios Japan is going one further and adding a Nintendo World area at a cost of $500 million, following the successful Wizarding World of Harry Potter, whose price tag was also reported as in the range of $300 million.
$500 million is how much Legoland New York is supposed to cost, in total.
Ticket Prices
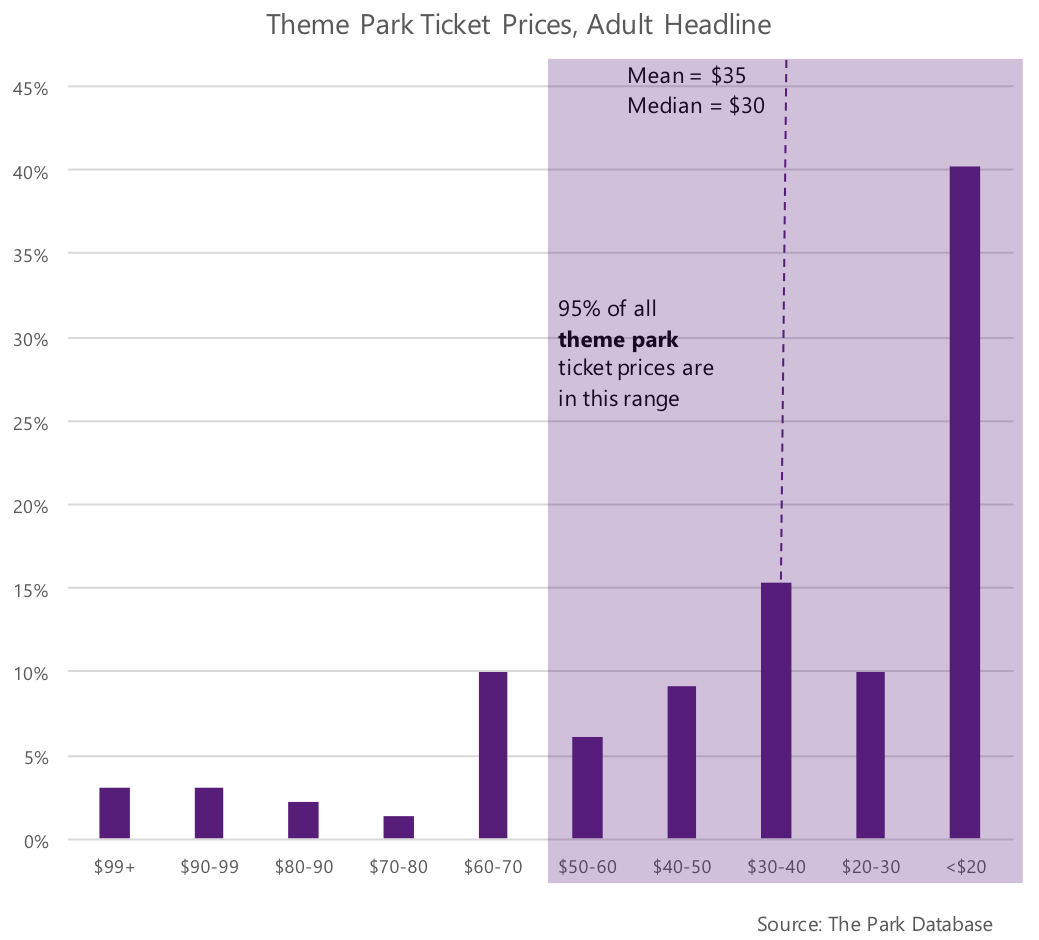
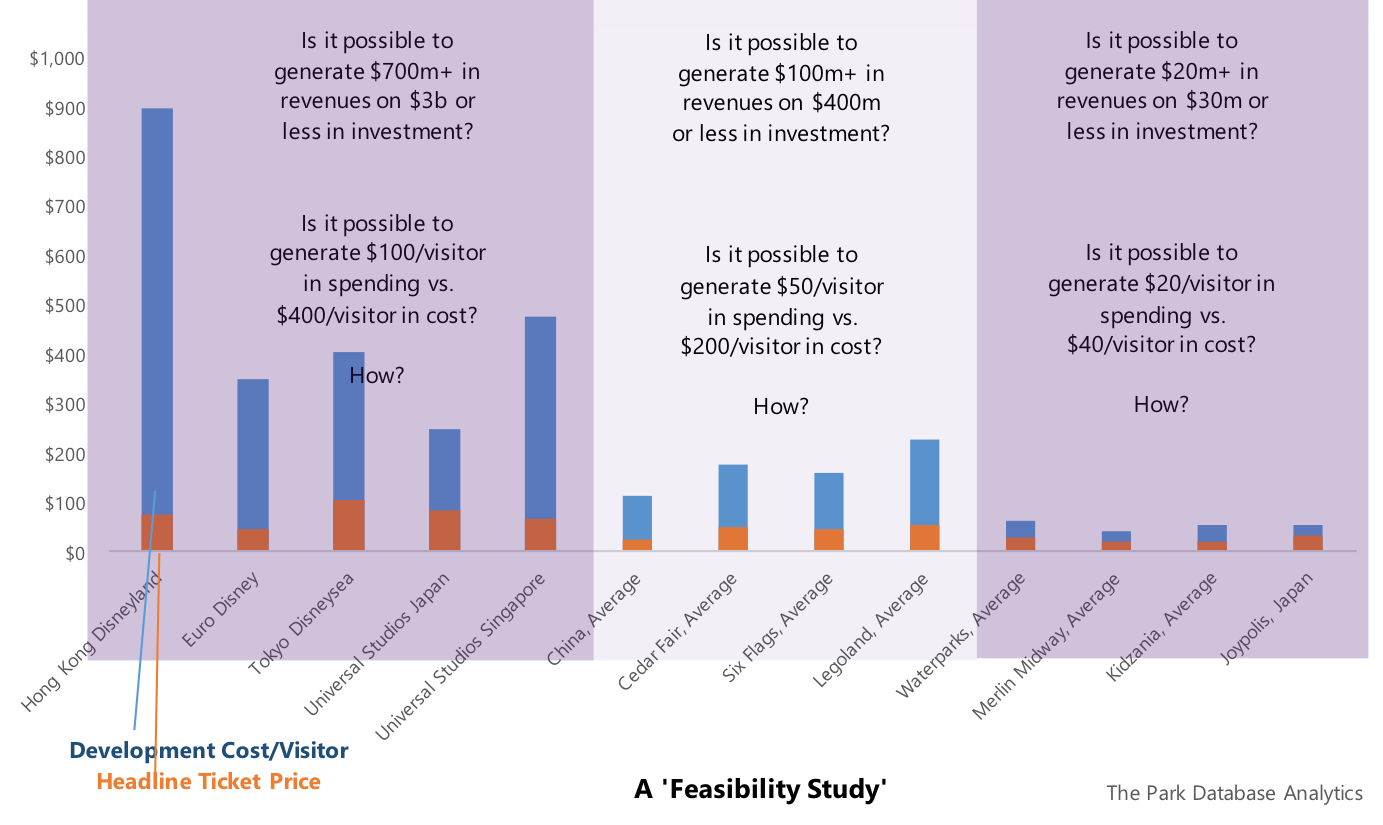
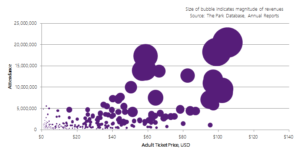
Next, while development costs can range greatly, especially on the high-end, ticket prices are much more constrained. The ticket price that guests are willing to pay for a location-based attraction; i.e., theme parks or waterparks, is relatively constrained within a range of $10 to $70. There is a strict price ceiling; i.e., no park other than Disney or Universal, with a few minor exceptions, can charge more than $90 in current terms.
Indeed, 95% of the theme park tickets in the world cost less than $60.
Now, while the maximum that even mega theme parks can charge one visitor is in the ~$100 range, the development cost per visitor has a much wider range. The development costs for a Disney or Universal park, per visitor, are relatively un-constrained, especially on the high end – with outliers like Hong Kong Disneyland effectively having costed almost $900 per annual visitor!
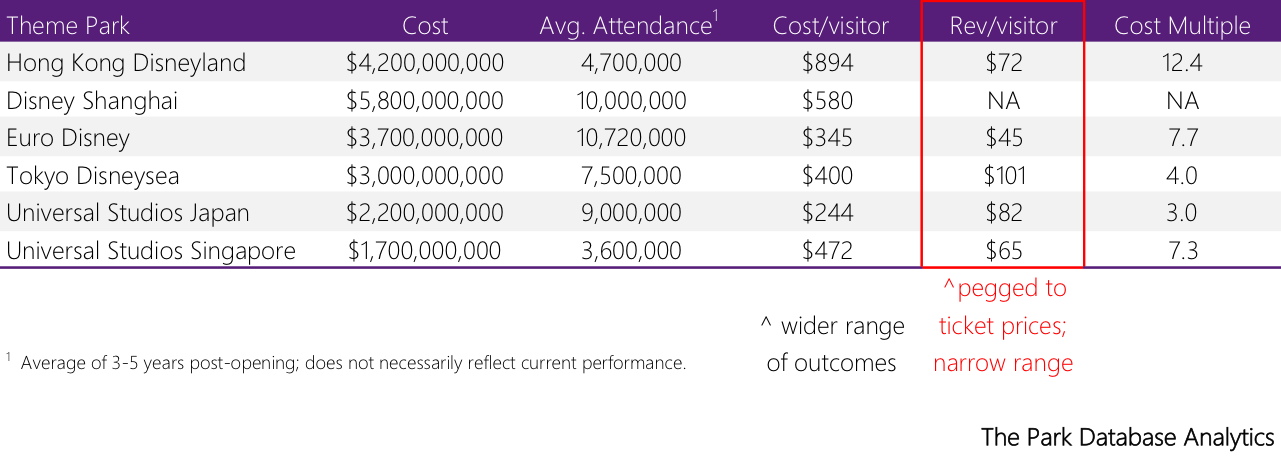
This relationship matters because total revenues per visitor are pegged to ticket prices. Ticket prices comprise the single largest category of spending for guests at theme parks and anchor guest perceptions of experiential value.
So when parks like Hong Kong Disney cost more than 12x revenues, that indicates…a very long payback period.
Case Studies
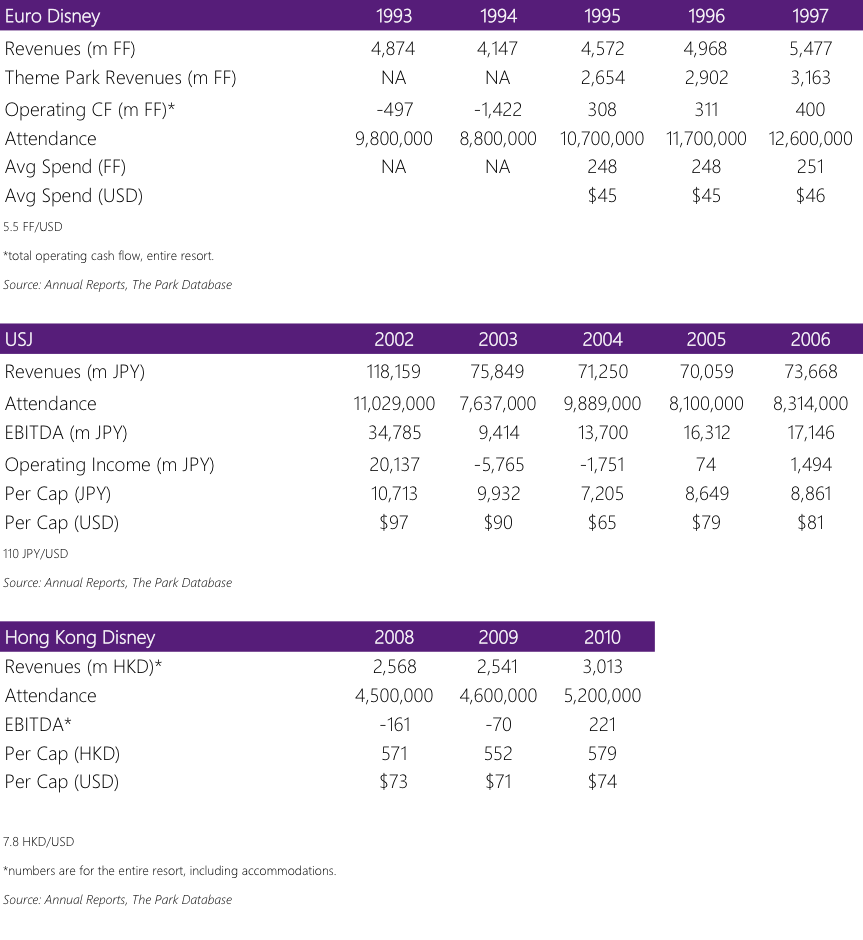
Indeed, the theme park business is a hard one, and it is not uncommon to have a barely break-even operation years after opening. Here are snapshots of three of the mega parks above.
- You’ll notice that Euro Disney, in the third year after opening, was generating barely $50m USD in operating cash flow for the entire resort, compared to a nearly $4b development cost. But at least cash flow was positive back then; the resort has struggled to even break-even during the last few years because of a massive debt load.
- It was a similar situation for Hong Kong Disney, built at a development cost of over $4b and not operationally profitable until 2010, five years after opening. Compare total resort EBITDA of ~$30m against the development cost.
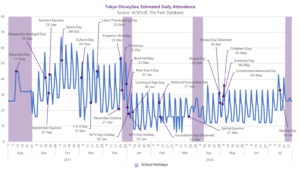
- While Universal Studios Japan generated positive EBITDA in the first years after opening, cash flows plummeted along with attendance in the second year, and did not return to its first year levels for many years. This effectively resulted in ROI in the low to mid-single digits.
A Caveat: Creative Financing
Although, to the last point, we offer a counterpoint. All this is not to say that Disney and Universal earn no money on their investments. Quite the opposite. In fact, Disney and Universal’s varied and major sources of financing likely enhance their returns greatly.
ALL recent Disney and Universal parks have featured highly varied sources of financing other than just equity:
- Disney invested less than 10% of Hong Kong Disneyland’s $4b+ budget. The rest was 90% financed, directly or indirectly, by the government in the form of equity, loans, infrastructure, land reclamation, etc.
- Similarly, Shanghai Disney was helped by the government’s investment in a dedicated metro line, preferential loans, government equity, land relocation.
- Euro Disney was financed through an IPO and add-on equity raise, government loans, low tax rates, infrastructure subsidies, accelerated depreciation, and real estate sales.
- Universal Studios Japan was subsidized with infrastructure spending, loans, and equity by the Osaka Municipal Government.
- Universal Studios Singapore was financed, essentially, through Resorts World Sentosa’s casino license (1 of 2 in Singapore). Casino revenues comprise more than 70% of the total resort’s revenues, while Universal Studios is an estimated 15-20%.
Further, this does not even mention the pre-opening sources of cash flow that Disney and Universal cleverly insert into their partnership contracts, including design fees, management and operational fees, licensing payouts and royalties beginning at contract signing, etc. etc.
Thus while mega theme parks, at the project level, are among the least profitable, let’s not worry too much on behalf of Disney or Universal who begin earning fees before the parks are even designed :).
Many would-be developers and governments miss this point.
Summary
Disney and Universal build so large not only because they have to, but because they can. The strengths of their brands allow them to negotiate with governments and banks to an extent that theme parks in lesser tiers would find it impossible to do. And for this reason, the spending is so massive that project-level returns appear to be quite paltry.
These operators are able to spend so much because the primary metric by which their government partners are judging success is not financial, but measured in economic impacts; tax revenues, foreign exchange earnings, employment creation, tourism growth, and output multipliers.
Walt Disney, both the man and the company, was and is a creative financing genius, which shall be the subject of a later post.
The Outperformers
Now let’s examine indoor theme parks and waterparks. At the project level, they have the highest probability of being profitable, with investment returns in the mid-teens to 20%+ range.
These are indoor parks that cost between $10-$30m to build, and generate cash flow (EBITDA) of between $3m to $10m. This class of smaller parks are both more efficient users of capital and space.
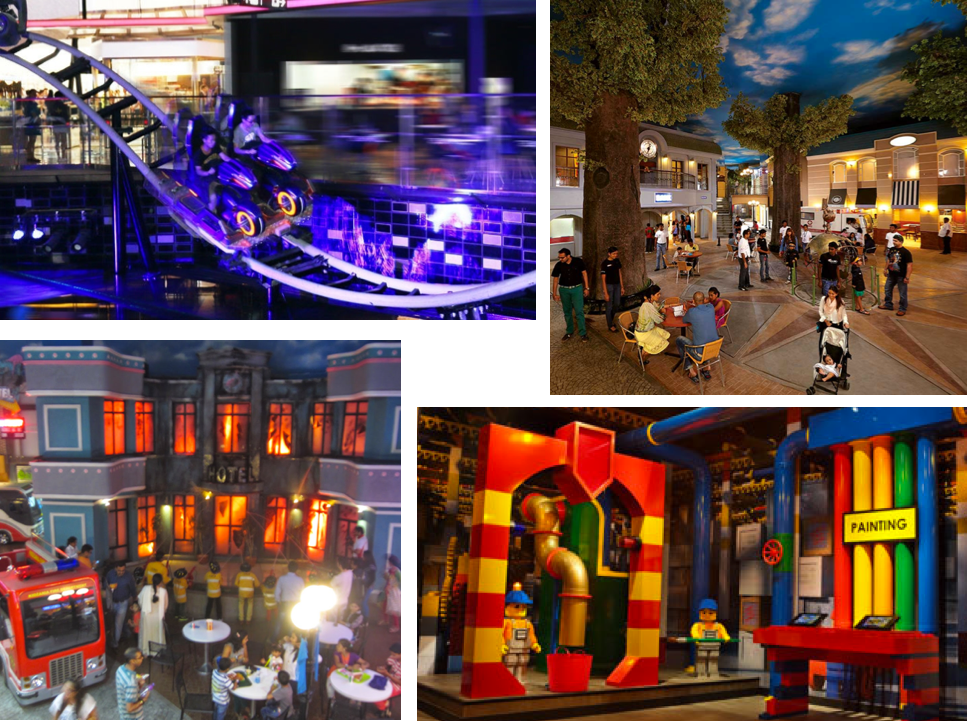
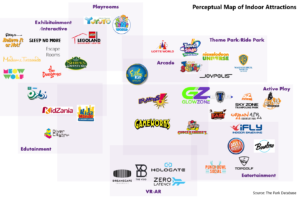
What we’re talking about when we talk about indoor theme parks are projects usually between 2,000 and 9,000 square meters in size, which act as anchors or inline tenants within urban retail environments.
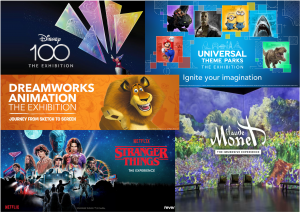
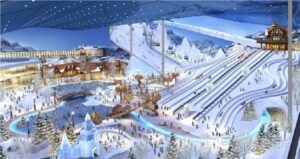
This class does not include indoor playrooms or kids cafes that are usually generic and less than 1,000 sqm, or indoor ride parks of more than 30,000+ sqm that happen to have a shell above them, such as Nickelodeon Universe, Lotte World, or Trans Studio. Some of the major brands in this category include Kidzania, Merlin Midway, and Joypolis. Some scenes are below.
Because of their smaller size, their sales productivity (per unit of area) is highest among all theme park categories. Their development cost per unit of area is also lower than that of mega parks.
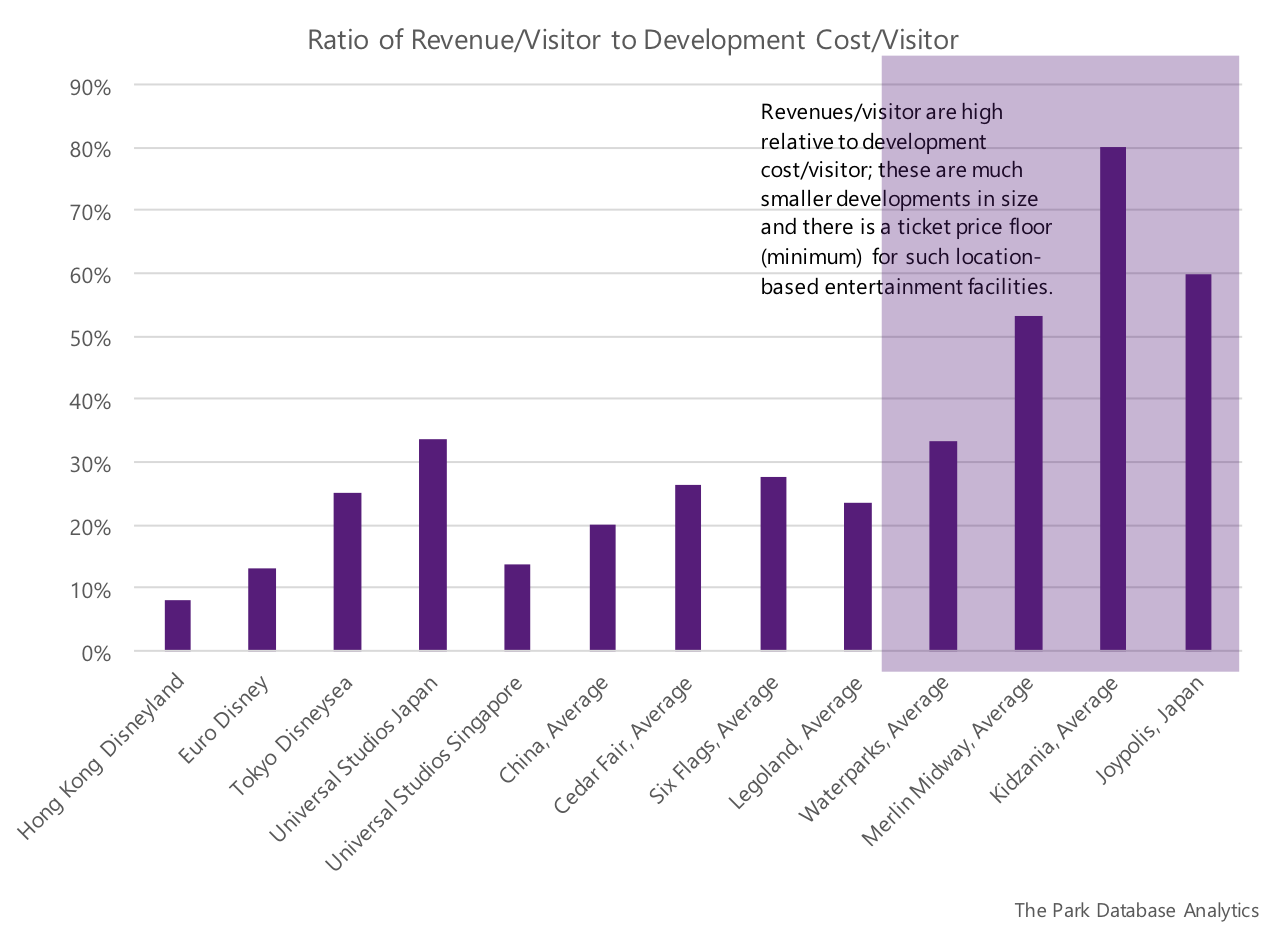
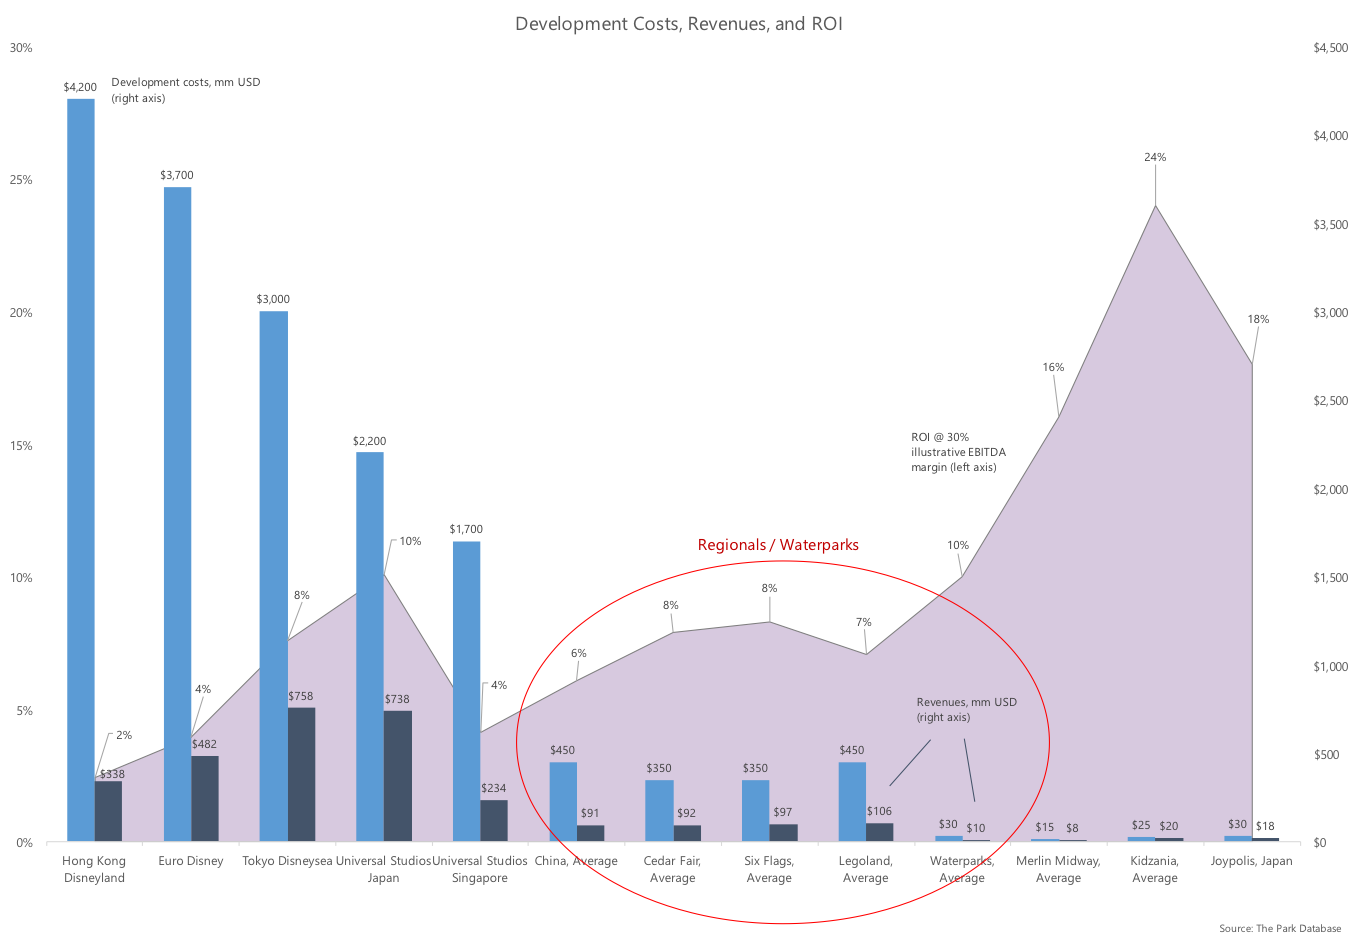
You can see this relationship even more clearly when we look at revenues and costs per visitor, as below. We return to the point about ticket prices again.
In the case of indoor parks, they benefit perhaps from the fact that there is a price floor/threshold; i.e., a minimum amount that people are willing to pay for a location-based attraction – in the range of $15-$20 for adult visitor.
When we compare revenues per visitor (which reflect this ticket price threshold) against development costs per visitor, it is apparent that, all else equal, this class of parks looks attractive from an investment standpoint.
For more on this specific type, refer to our guest post on the Global Real Estate Experts blog.
The Regionals/Superregionals
Finally, right in the middle of the pack are regional and super-regional parks.
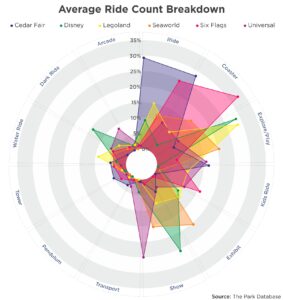
In this tier, we have a lineup of very famous brands that are not Disney or Universal, such as Legoland, Cedar Fair, Seaworld, and Six Flags. These parks cost between $200m to $500m to construct, and earn (EBITDA) between $30m to $100m.
There is no clear definition about what parks are in this category. In most cities where there is no Universal or Disney park, these regional / super-regional parks are the major theme park of the market, even if it doesn’t have a world-renowned brand.
Operations such as Tivoli Gardens in Denmark, Everland in Korea, Parc Asterix in France, Alton Towers in the UK, etc., come to mind. Most have been around for decades (centuries in the case of Tivoli). Once again, the parks we review below are ones that have revealed their data publicly. And no, we didn’t include Tivoli, whose development cost is from the 19th century and was too hard to calculate 🙂
This category is interesting for several reasons.
Low $/sf
First, notice that this category of parks is usually the same size as parks in the Disney/Universal category, in the 200,000 to 400,000 square meter range. Yet, their revenues are a fraction of Disney/Universal’s. This sets us up for some interesting implications.
Now, even if this category of parks earns $100m to $300m in revenues, the latter of which is on the high-end, this is still a fraction of what a similarly-sized Disney or Universal would generate. This means that sales productivity (in terms of sales per unit of area) is low. A $200m revenue park spread over an average-sized area of 30 hectares (300,000 sqm) translates into sales of ~$670/sqm, or ~$60/sf.
As a piece of yield-producing real estate, this is quite low.
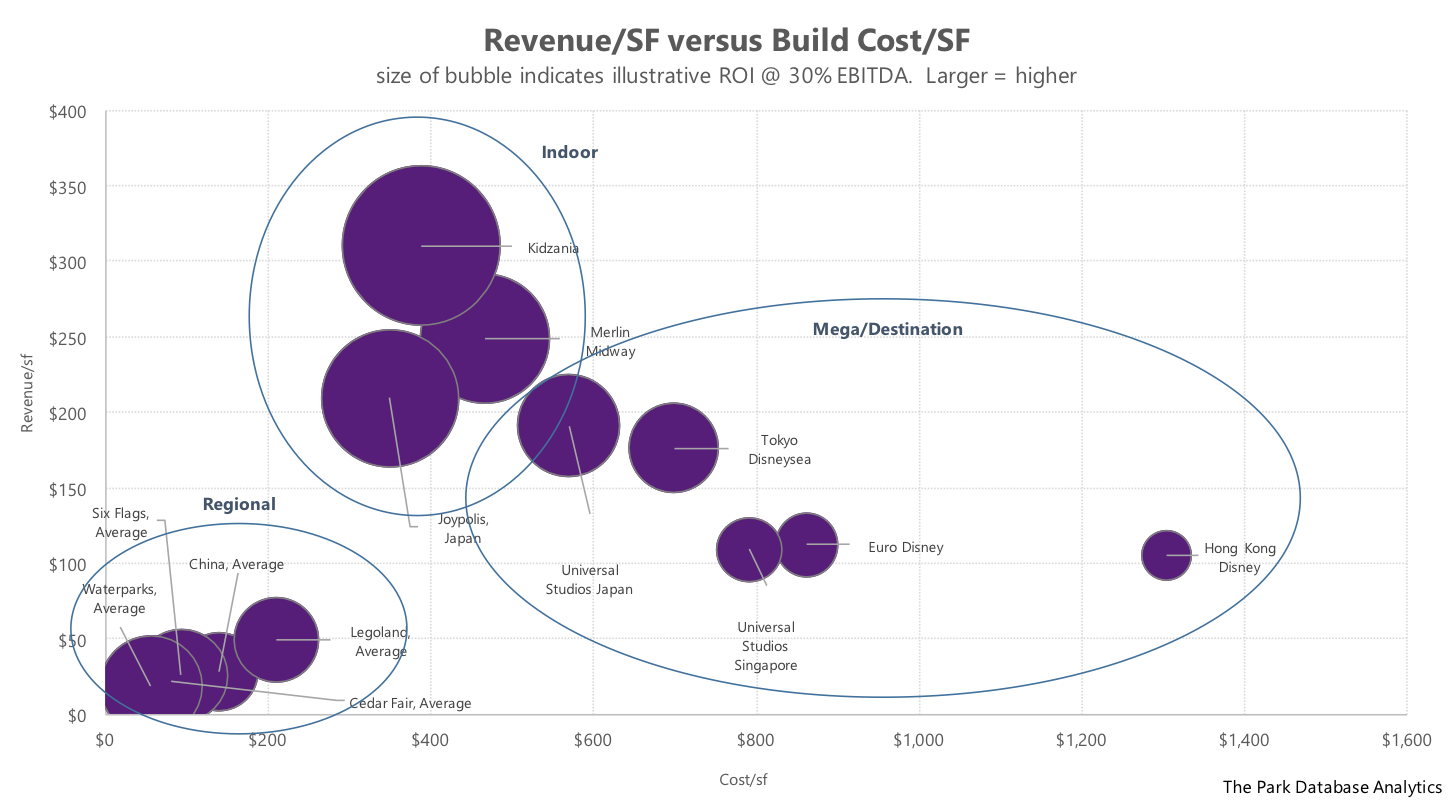
Returning to this chart, we can see that regionals are indeed the lowest-performing (lower left) in terms of revenue efficiency per unit of space.
On the other hand, they also cost the least in terms of unit of space.
A Time and Place for Everything
This brings us to one of our theses, which is that regional and superregional theme park development may be a relic of certain macroeconomic and socioeconomic conditions. In the developed world, this convergence of conditions has largely passed. In certain other geographies, however (China + Middle East, to name names), this is still ongoing.
In the developed countries and cities of the world, purely private theme park development was often a relic of low land prices and lower expectations, to name some of the more important ones.
With growing and rapid urbanization in most countries, as well as central bank policies, land prices have appreciated – and continue to appreciate – at a rapid pace, crowding out the potential for large amusement or recreation parks.
If we simply consider the development history of theme parks in the United States, we can see that most of the major parks were built in the 1960s to early 1980s. Ask yourself, looking at the list below, if there’s been another major park in the vicinity of the metropolises below, in the last 20-30 years. Not counting second gates and Orlando. Is there one?
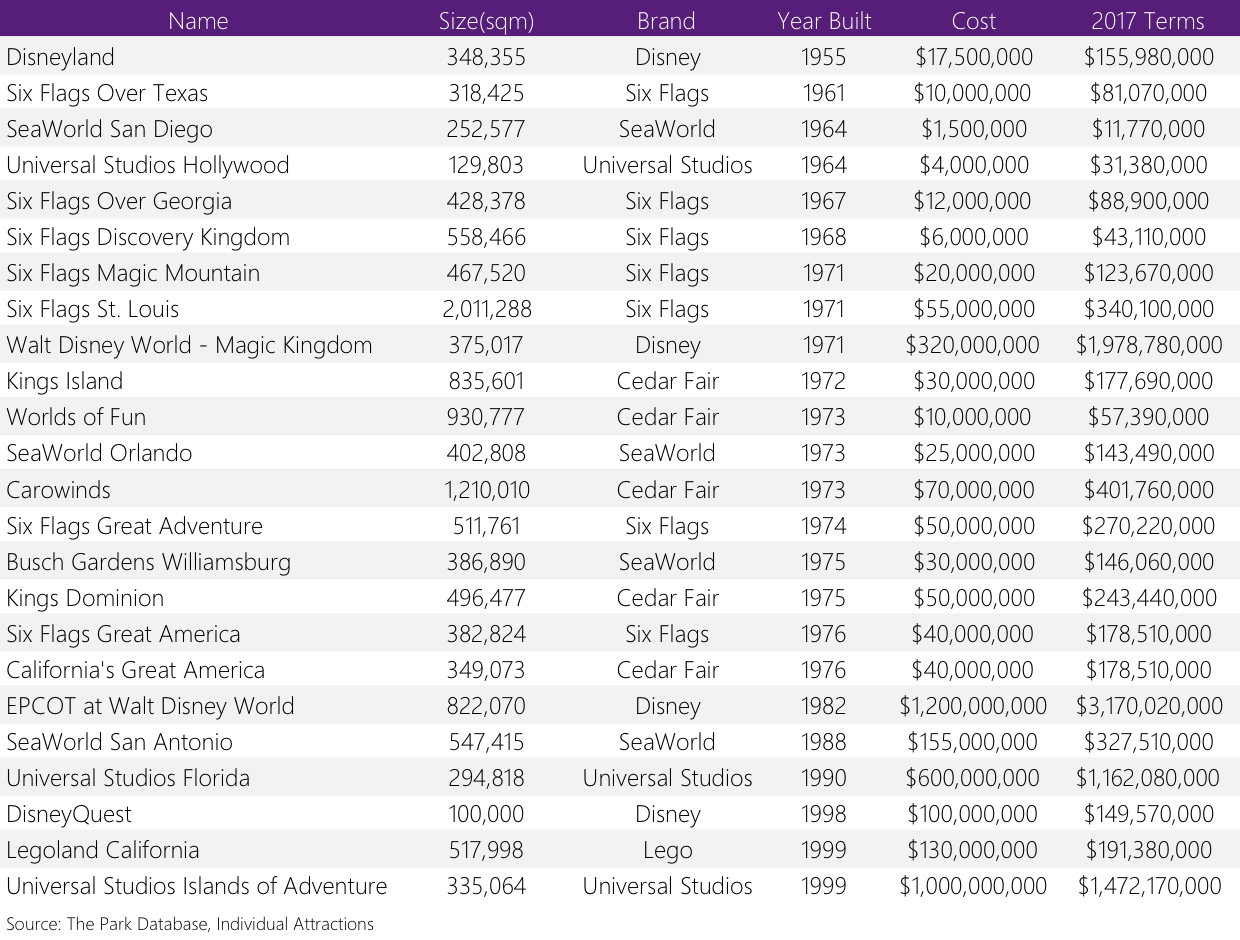
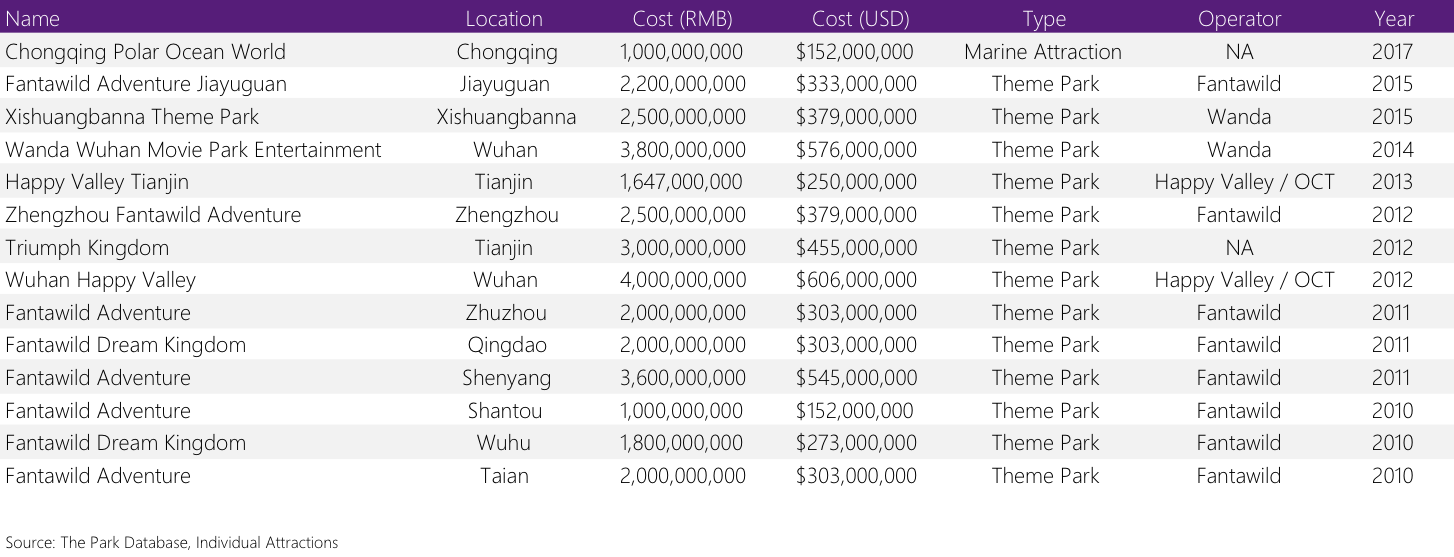
Now, let’s see what’s been happening in China. It’s no secret among industry insiders that China has dominated theme park development in the last decade, accounting for nearly a quarter to a third of all theme park openings since the year 2000, as below.
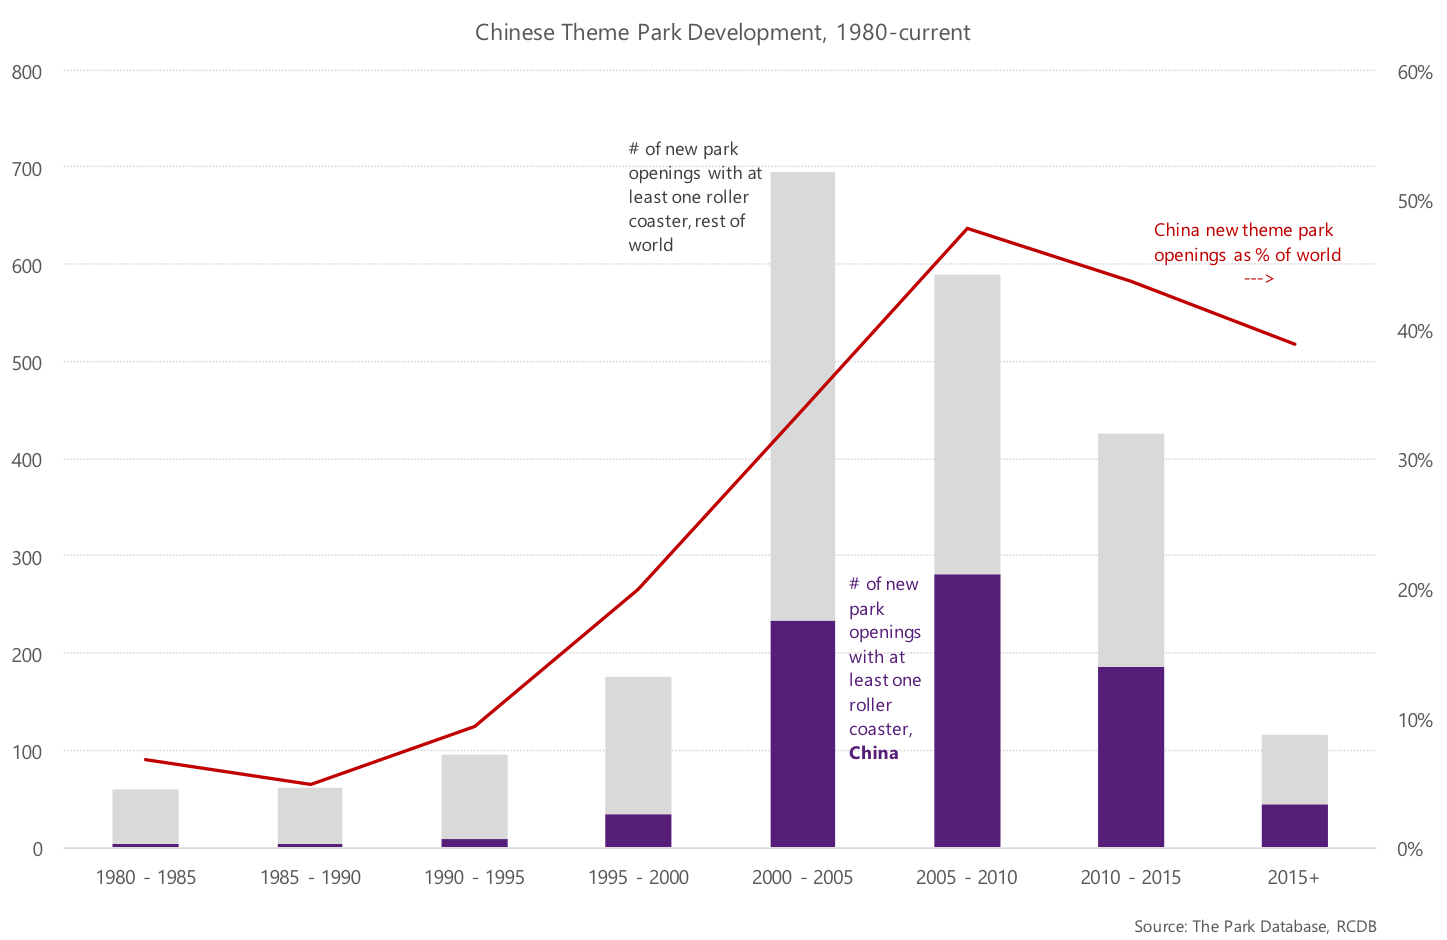
And the theme parks that are being built in China are regional parks, notwithstanding the blustering of certain property moguls.
Their attraction mix (hard ride-based) more closely resembles that of Six Flags and Cedar Fair than it does Disney or Universal, and their development costs, in USD, are also in the range of $100-$500m. Does it not resemble the US during the 1960s and 1970s?
Once a regional park is built, it is very difficult to build another in the same market.
As land prices and urbanization increase, the opportunity cost of setting aside 300,000+ square meters in order to generate less than $100/sf in revenues is simply prohibitive. Moreover, selling the positioning and differentiation angle to the consumer is almost impossible when there’s already another regional park in the market. This means that existing regional theme parks are usually minor monopolies in their regions.
As an ending note we need to mention that in both China and the Middle East, governments and other sovereign-related entities are sponsoring theme park development. And theme park ‘returns’ in these geographies are measured mostly not in financial terms, but employment, prestige, branding, tourism impacts, and GDP multipliers.
For this reason it’s not always wise to include China into a discussion with Legoland, Cedar Fair, and Six Flags, but this is an interesting point nonetheless.
Waterparks
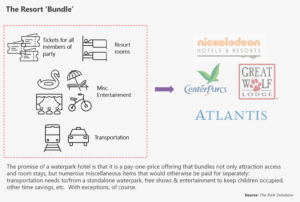
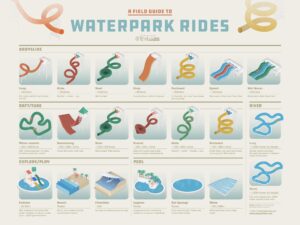
Waterparks deserve their own post, as they are category unto themselves, but it’s interesting to measure them side-by-side with other types of theme parks. The major points we want to make here are that:
- Waterparks are smaller than theme parks, at 10,000 to 60,000 square meters, on average;
- They likewise cost a fraction of their outdoor theme park equivalents, with the largest waterparks costing anywhere from $60-$100 million, maximum;
- But in many markets outside of the United States, the price to enter a waterpark is nearly the same – if not higher – than a theme park in the same market. All this makes waterparks attractive from an investment standpoint as well.

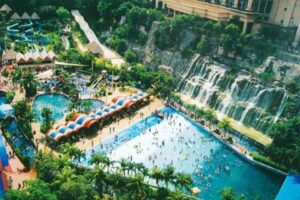
For this reason, waterpark development has been torrid (torrential?) in China, Southeast Asia, and the Middle East (hospitable climates for waterparks, to be sure). Let’s take another look at the chart below.
Given that the cost/sf and revenue/sf between waterparks and the regional parks are similar, what kind of project would a risk-minimizing developer choose, when the investment level for a waterpark is in the range of $30 million, compared to a regional park that costs 10 times that amount?
Summary
Despite our extended rambling, we’d like to think that you can leave with some concrete implications. In summary, here are some of the major ones.
- Mega theme parks such as Disney and Universal find it difficult to be profitable in the first few years after opening, and have a very low project ROI. But it doesn’t matter.
- Don’t seek to compete with Disney or Universal, unless you are them, or you can line up tremendous sources of financing. Look for creative sources of financing.
- For investors, indoor parks are promising because they generate enough in sales productivity to be appropriate for urban retail environments.
- Regional and superregional parks are appropriate when land prices are extremely low, and the market does not have similar types of developments. They can be built relatively cheaply. And once built, these parks can become the landmark attraction of a market for decades.
- Waterparks are often a more efficient alternative to regional parks, in that they occupy less space but have a similar return profile.
- It’s important to define the return measure for attractions. Very often, the partner/developer/government cares less about financial returns and more about employment, tourism, and GDP impacts. Governments can be a good partner. On the other hand, don’t benchmark these kinds of developments if you’re a purely private operation.
Business Planning
From our decades in the business, we’ve encountered hundreds of would-be theme park developers who immediately will point to the first tier and insist that their parks will generate Disney or Universal-like performance, without spending nearly enough.
While there are plenty of advisors out there who will happily take huge consulting fees to prepare self-justifying financials on pro forma, we’d like to urge anyone in the business to stop and think about the real issues here, and offer these pieces of free advice to serve your theme park or amusement park business plan or feasibility study. Don’t read it if you like to waste hundreds of thousands of dollars in ‘consulting’ fees.
As Charlie Munger says, sometimes the best thing to do is invert. And in inverting the problem of attraction performance, we find that the 3 real questions, in order, are:
1. What type of park are you attempting to develop or acquire?
2. Given the type of park, what is the worldwide range of performance for that tier; i.e., what is the range of outcomes you can expect? Generate a scenario analysis for your development around this range.
3. Finally, most importantly, what will it take to outperform within that range? In terms of design, content, positioning, market availability, and competitive dynamics? Does the local market support a ticket price tier of $30+? $40+? $50+? $60-80+?
We can easily see that in each category, there is a performance range. The question any motivated developer, investor, or government should be asking is what it would take to outperform and/or be more efficient within each range. Viz.,
- Indoor park: is it possible to spend $10m on a park and generate cash flow of more than $3m? What would it take, in terms of an experience, for people to spend up to $40-$50 USD per person. If you have to spend at least $30m for your vision, how do you increase throughput (attendance) or spending to above $50 USD per person? Find more details for indoor parks in this post.
- Waterpark: is it possible to spend $30m on a park and generate more than $8-$10m in cash flow? What would it take, in terms of the experience, for that to happen? How do you get people to stay as long as possible and spend more by disguising ancillaries as necessities?
- Regional/superregional park: is it possible to build smaller, say, 100,000 to 150,000 sqm and deliver the same experience? I.e., is it possible to achieve a throughput of 4-8m people within that space? It is possible to build a regional park for less than $300 million? Conversely, how do we achieve a cash flow of more than $50-$100m? How do we get people to stay longer, and spend more?
- Mega: what is the next government and market we can partner with? Is it possible to spend less than $3b for the park and achieve DisneySea-like return numbers? How do we increase spending in all of our parks to the $80-$100 USD range?
This article is part of our series on attraction economics.
Part I, relating to revenues, is here.
Part III, relating to funding sources, is here.
Part IV, relating to the composition of revenues (attendance and per capita expenditures), is here.
If you’re ready, develop your own models using the same template we use.


