Variability causes chaos. And variability when it comes to the attraction world, is perhaps nowhere so present or prominent as it is when designing and operating a theme park.
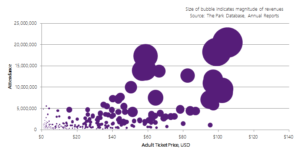
Compared to other types of real estate or property, theme parks might be the most extreme in terms of variability. Compared to commercial properties that provide services in return for 1, 3, 5+ year contracts, a theme park provides entertainment and leisure on the basis of 1-day tickets. This causes enormous demand swings depending on holidays, vacation periods, and weather.
And compared to, say, a hotel, which also experience similar types of peaking, theme parks have the additional complexity of having to manage hourly peaking within the day.
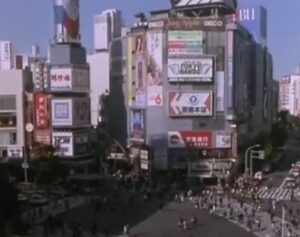
As an illustration of the seasonality experienced by theme parks, we are covering the Tokyo Disney Resort parks in this article. Not only are Tokyo Disneyland and DisneySea two of the highest attended parks in the world, they are also subject to average temperatures that swing from freezing to sweltering throughout the year, vacation and holiday periods: and so they experience a full range of seasonality factors.
Extremes
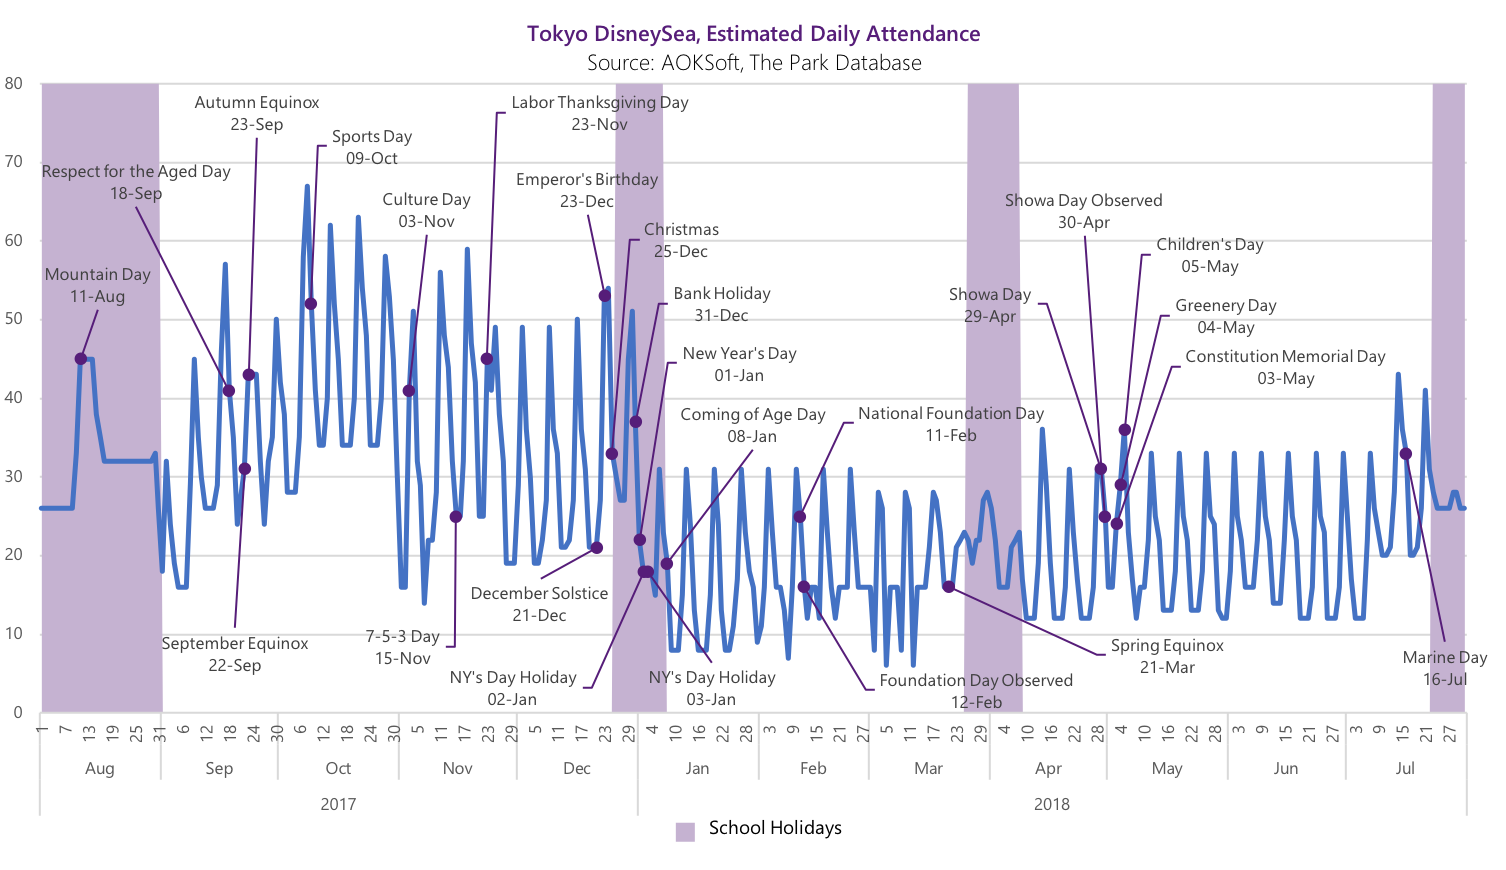
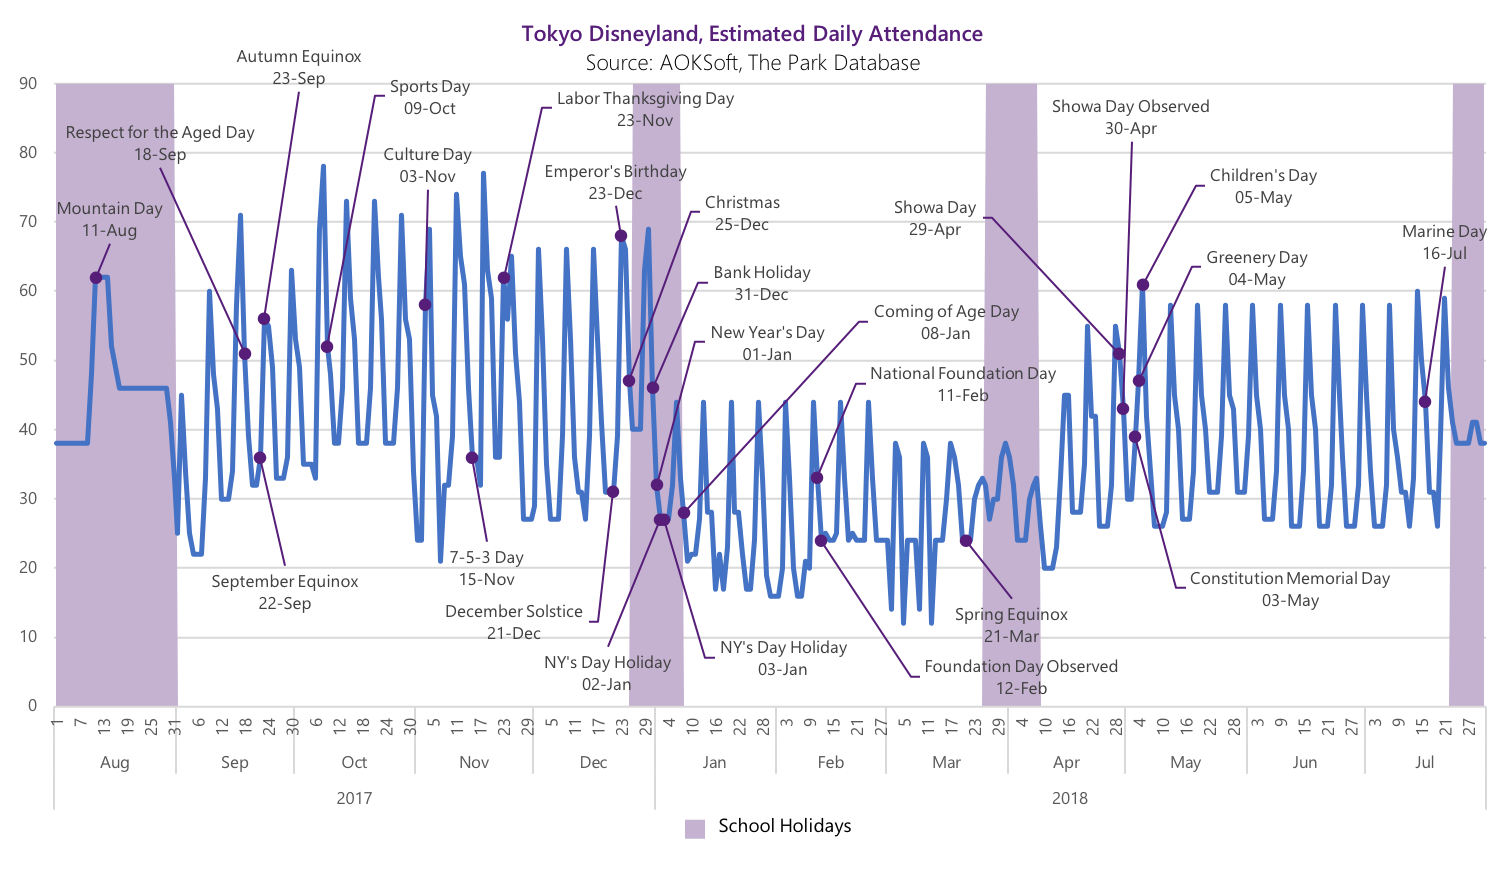
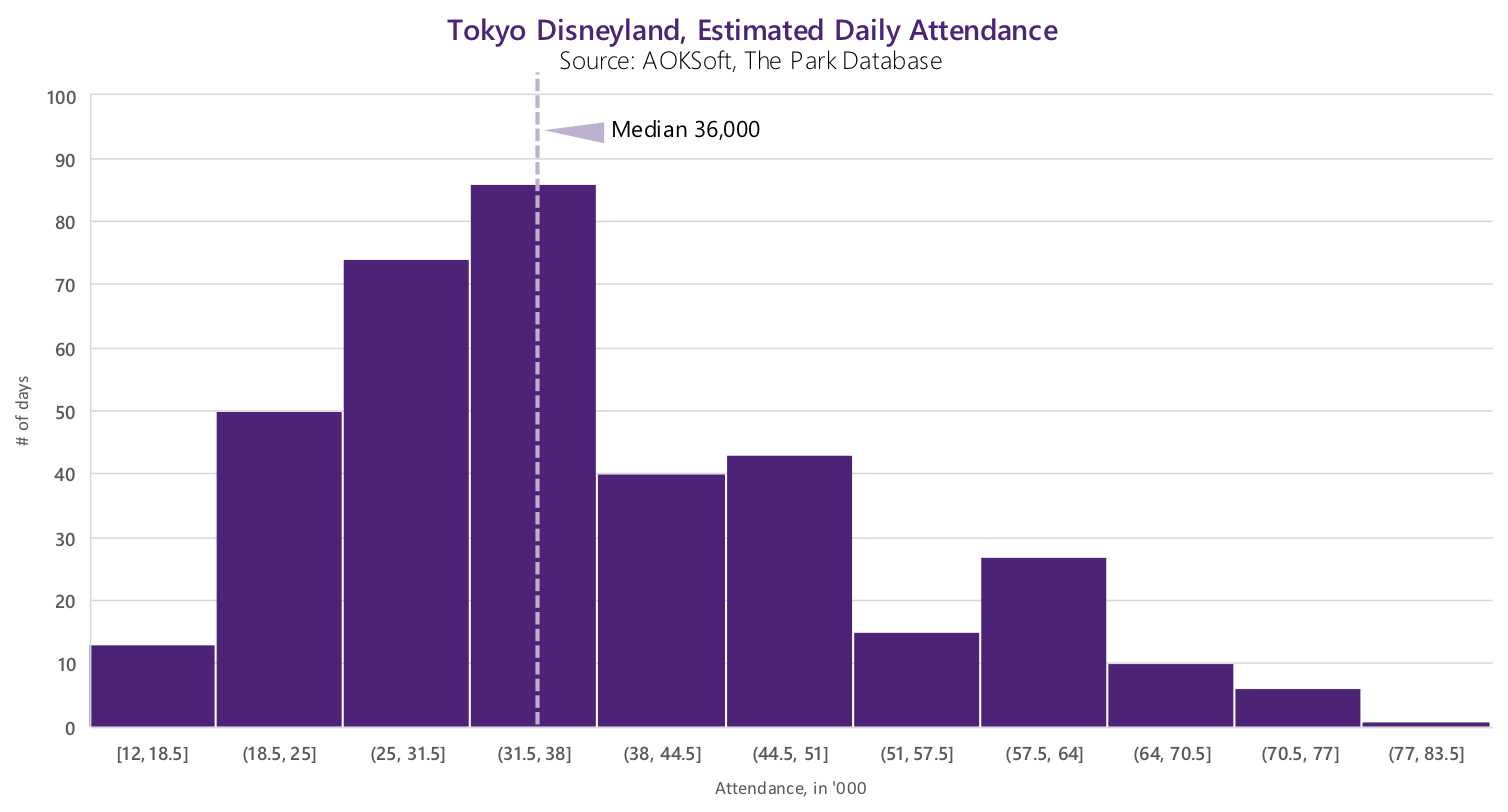
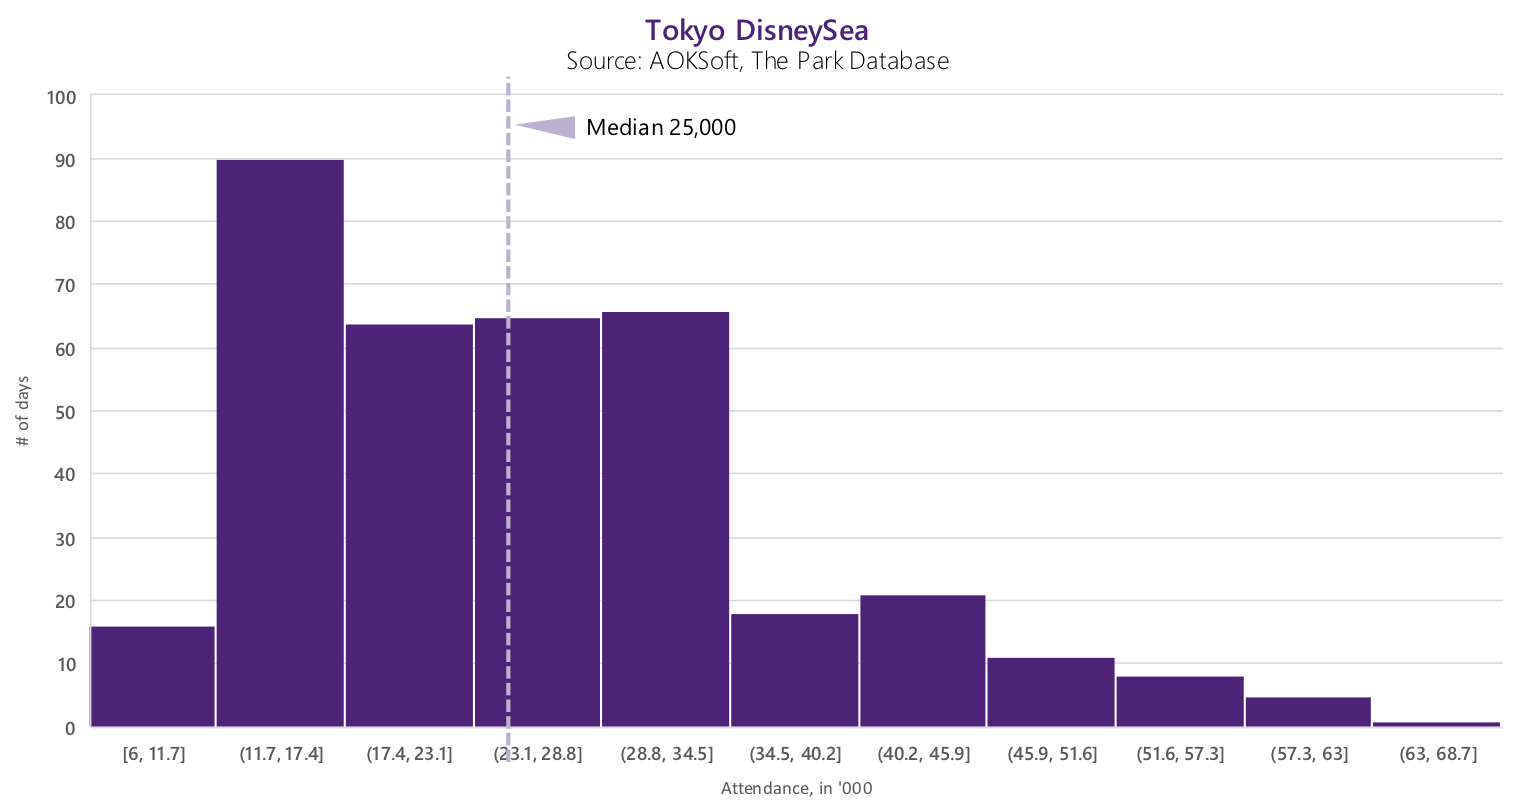
The extreme variability of annual attendance can be seen on the charts below. Often clients will ask us what the ‘average’ attendance of an attraction will be – and unless you have an attraction that has steady attendance distributed evenly throughout the year, this is a nonsensical question.
At both Tokyo Disneyland and DisneySea, you can observe that its extreme variability, with daily attendance at 10,000 during the winter months, to nearly 80,000 during the fall months, is a 700% swing.

If we really wanted to figure out the ‘average’, or ‘median’ attendance, we could, but this has little applicability beyond the mathematical exercise.
Instead of asking what the ‘average’ attendance is, it’s best to look at this as a capacity management exercise – how to best shrink and increase capacity of attractions, labor, and services both during the week and throughout the year?
Seasonality Notes
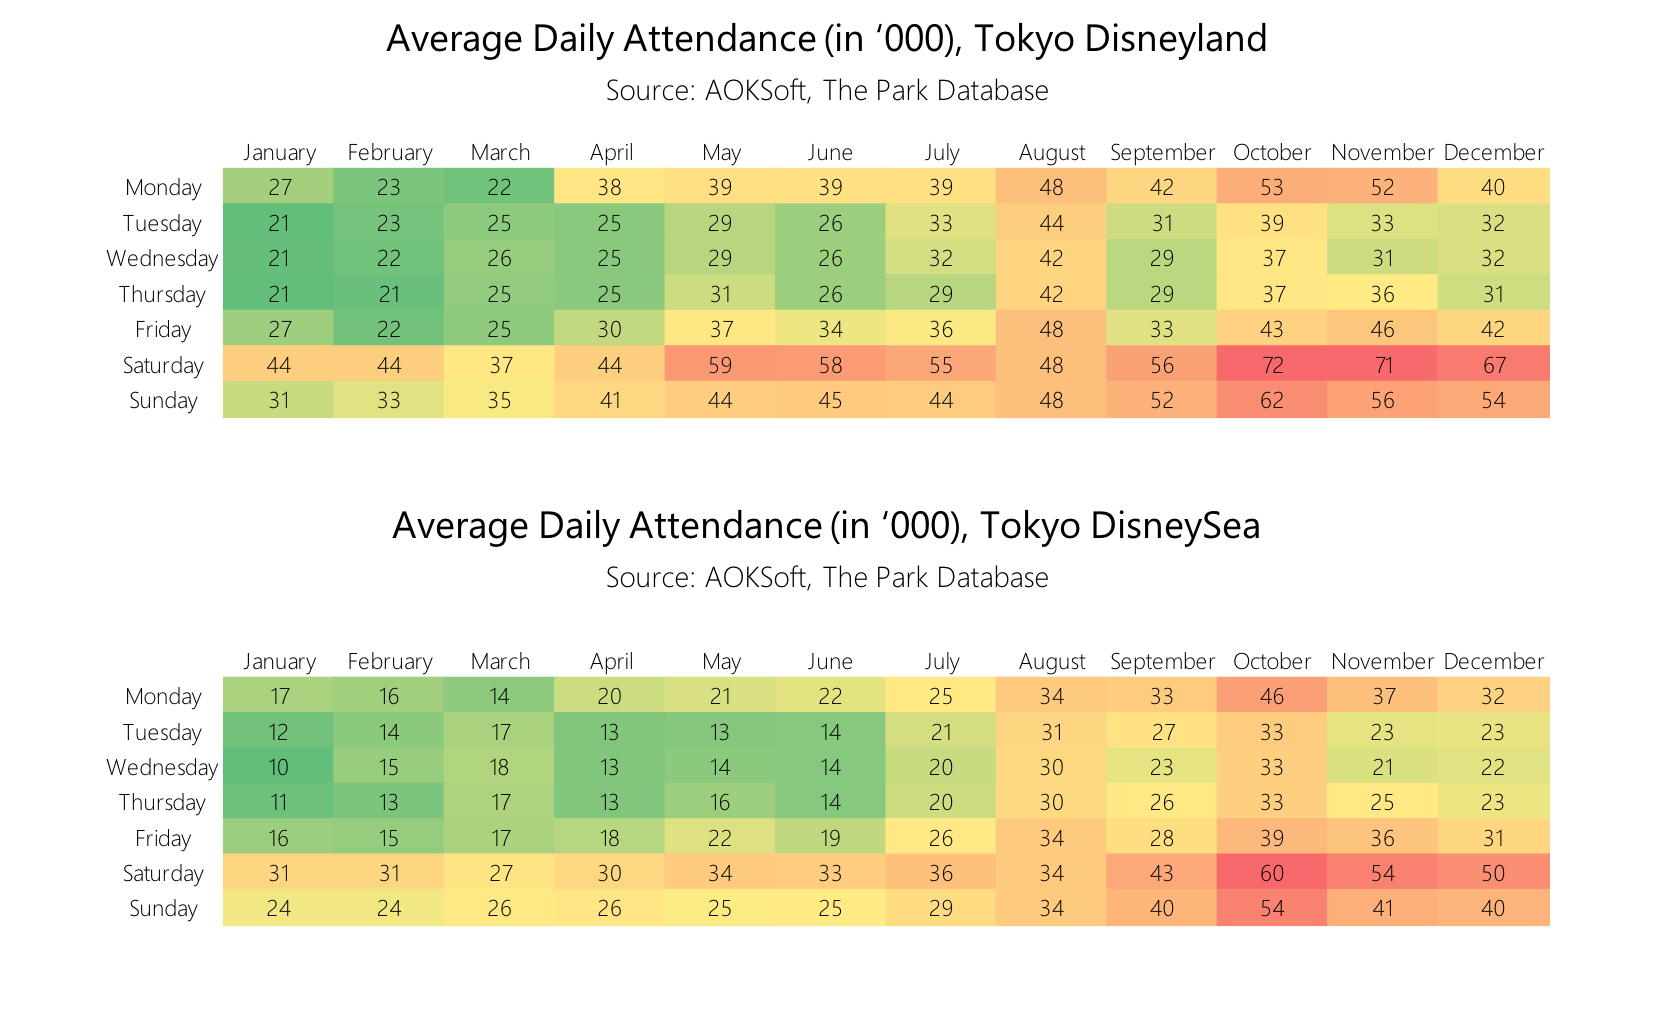
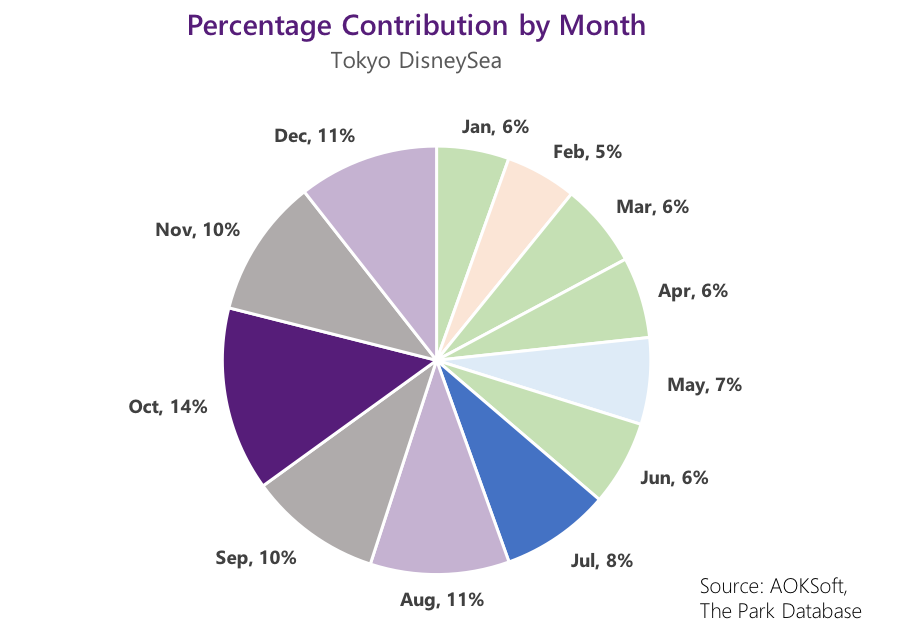
- For Tokyo Disney Resort, the peak month is in October. A combination of pleasant weather and seasonal events (Halloween) drive peaking to absolute extremes during its weekends, though.
- The span of green between January into early summer are the low periods; this was surprising to us, especially as schools break during the March and April months.
- August is an interesting month for its relatively flat seasonality, and attendance almost equivalent between weekdays and weekends.
- Weekends, expectedly, experience very high peaks. During some months, the Saturday visitation is nearly triple the average weekday attendance (see: January, DisneySea), and on average, Saturday & Sunday visitation accounts for 40-50% of the entire week’s attendance.
Peaking Ratios
Here’s a brief overview of the peaking ratios that the Tokyo Disney parks experience.
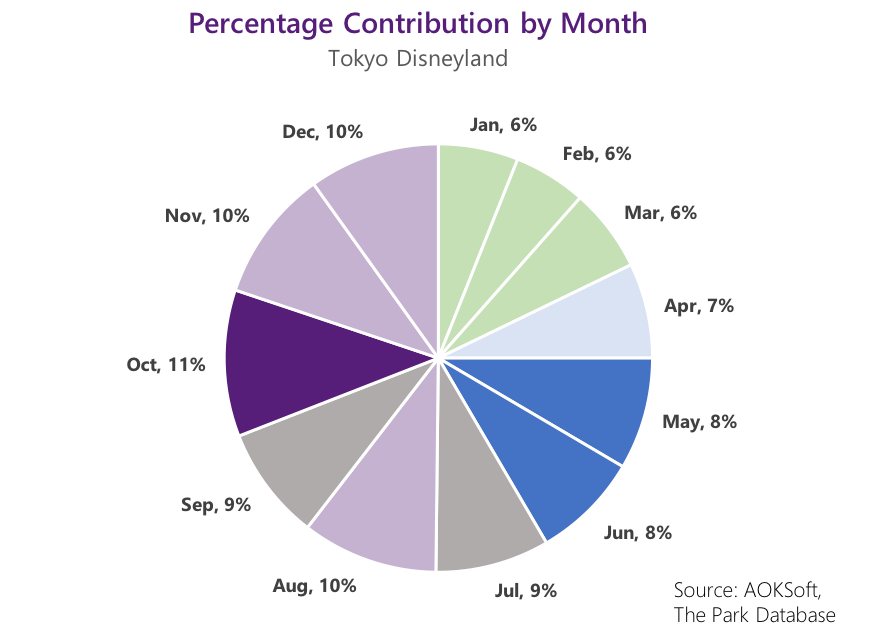
- The peak month is approximately 11-14% of the annual attendance.
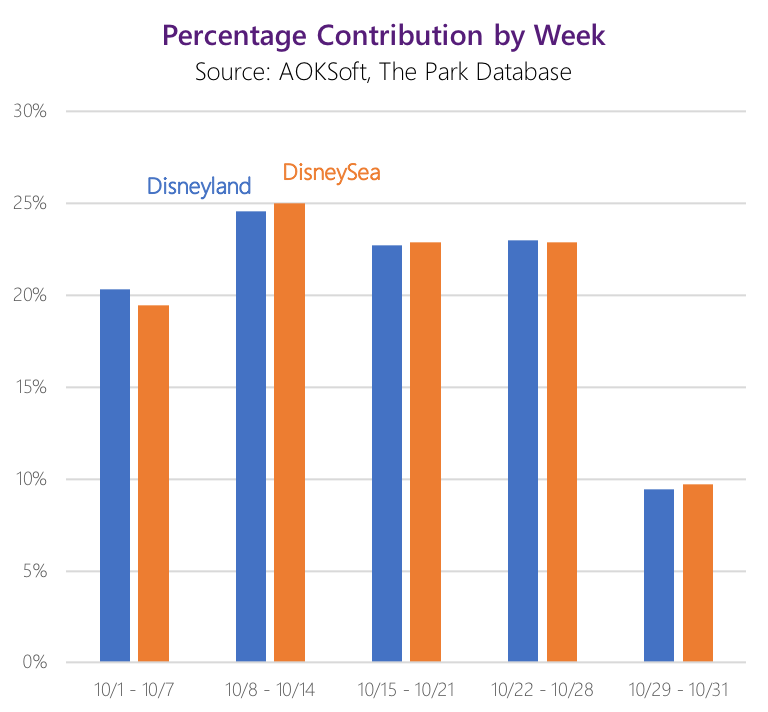
- The peak week, of that month (October) is approximately 25% at both parks. This is not a foregone conclusion of dividing 1 week by 4 weeks/month; October has 31 days so the average week would be ~23%.
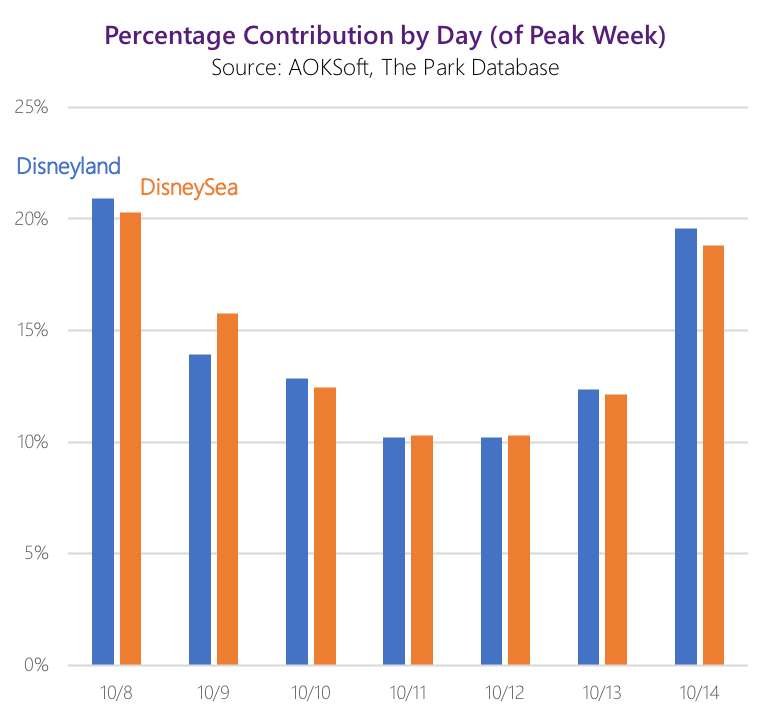
- The peak day is about 20-21% of the peak week.
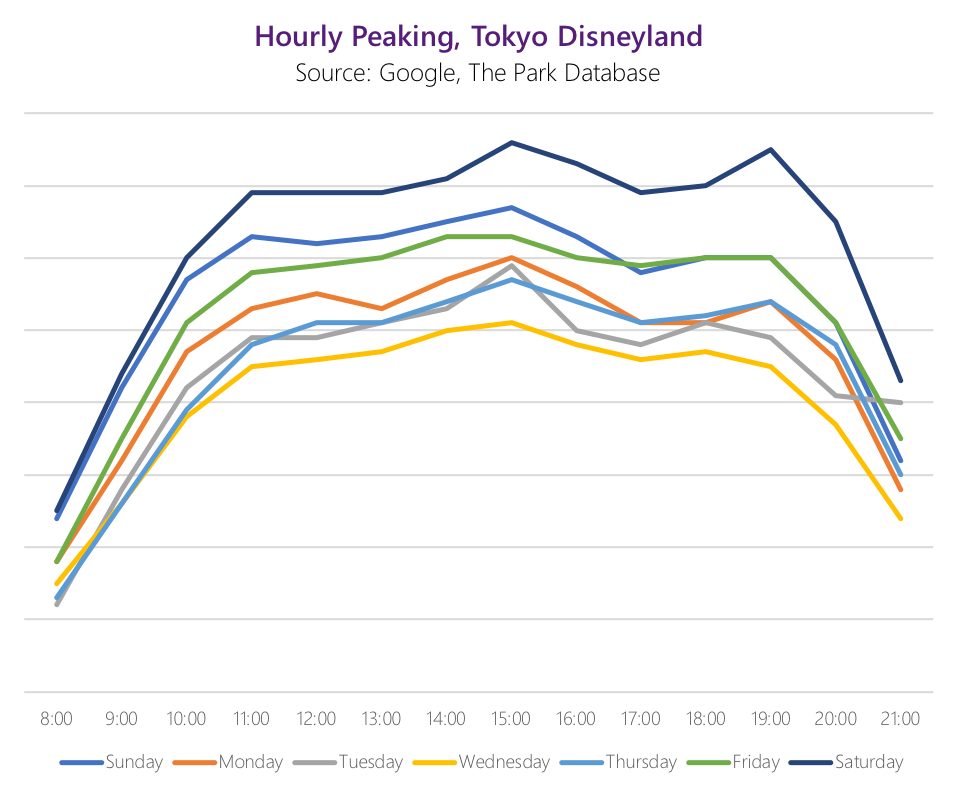
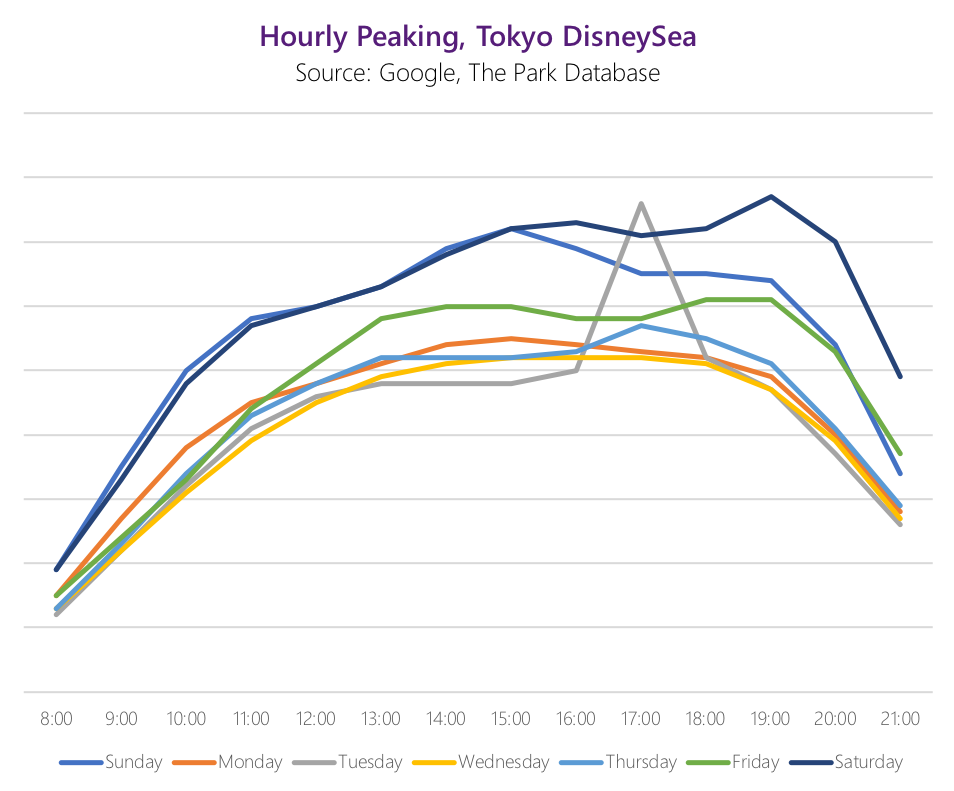
- Just as attendance is not evenly distributed during the year, month, or week, attendance ebbs and flows during the course of an operating day. In Tokyo Disney’s case, we see that this peak tends to be around 3pm, while Tokyo DisneySea’s peak skews later on Saturdays (night shows) and Tuesdays. Based on the 8-9 hour average length of stay that Tokyo Disney experiences, combined with its 14 hour operating schedule (8am to 10pm) during peak seasons, we estimate about 75-80% of the design day attendance will be present during the peak hour.
Design Day
The design day is a theme park design principle; specifically, that a park’s capacity should be designed to the average of its highest attended 15-25 days.
Designing to the absolute peaks would be folly, because the park would then run empty during most of the year – while from a guest experience it might be fun to go on all the rides three times in a row, from the park’s perspective, this is inefficient and costly.
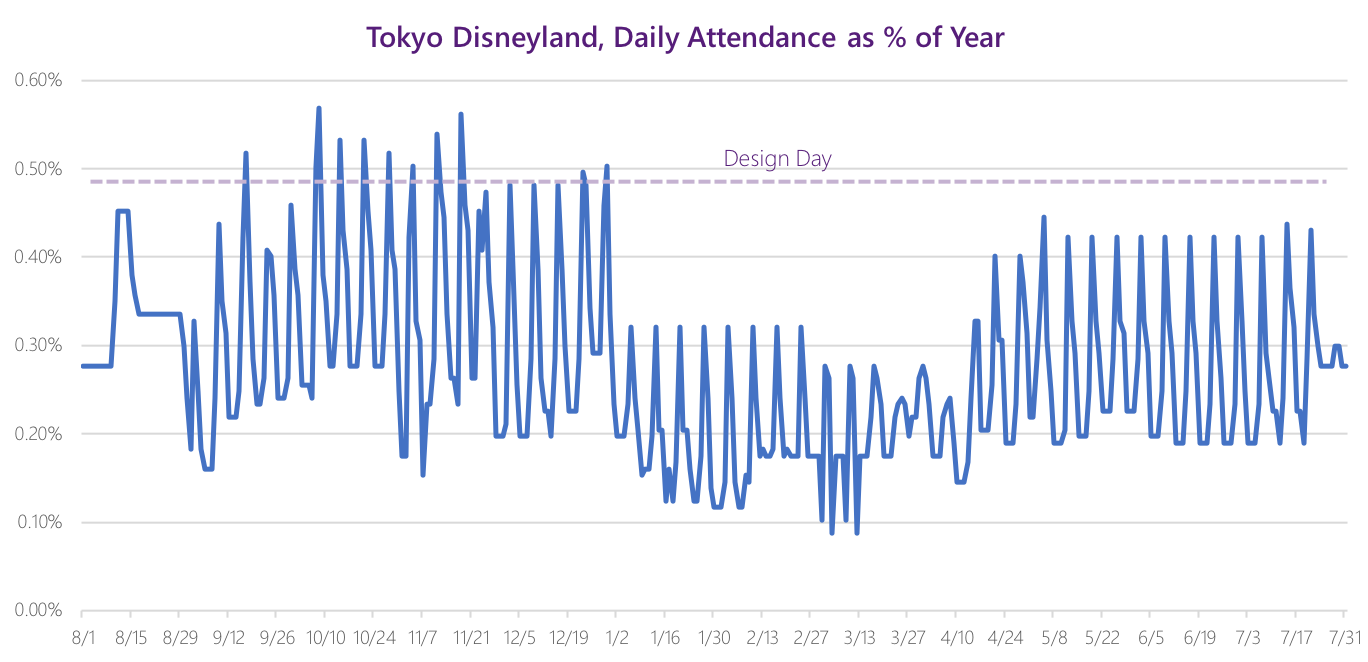
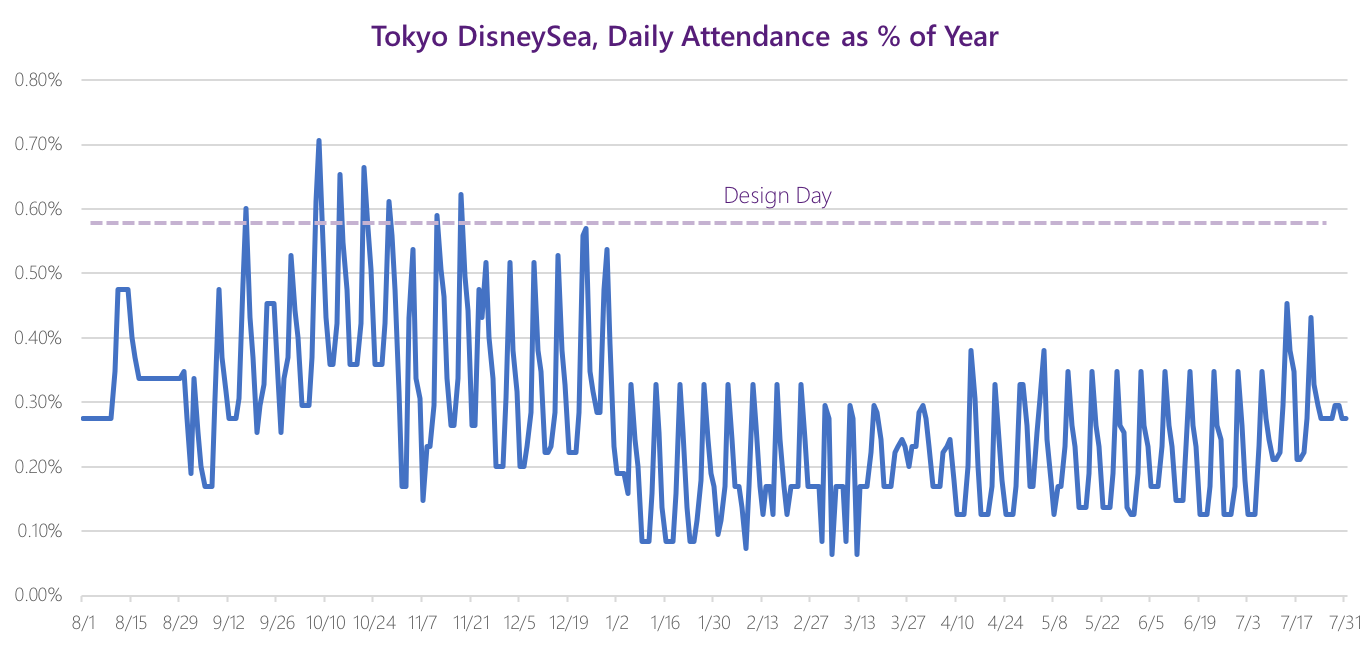
Using design day theory (that a park should be designed to the average of its highest attended 15-25 days), then we see that both parks should be designed to approximately 0.5-0.6% of the annual attendance, on average.
Summary
The seasonality of an existing or proposed park leads to operational complexity. For potential parks, planning around these peaks is one of the most important design decisions that a planner can make. For existing parks, operating around these peaks is one of the most important operational challenges.
With all that said, this analysis also shows us that the best time to visit one of the world’s best theme parks, DisneySea, is Tuesday, Wednesday, or Thursday during the winter. Noted.
We hope that insight in itself is worth the read.
If you’re ready, develop your own models using the same template we use.