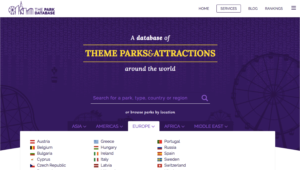
In Part I of this series, we reviewed topline economics for theme parks and attractions, and noted a defining characteristic of the industry: revenue is distributed along an extremely long tail. Out of thousands of attractions worldwide, only a small handful generate more than $1 billion annually. Below them sits a modest tier of super-regional and regional parks, followed by a vast universe of attractions earning under $100 million per year.
At its most basic level, attraction revenue = attendance x per-capita spending. What is striking is that both of these variables are themselves unevenly distributed – and this combination is what creates the characteristic long-tail pattern.
 We’ll unpack both of these factors – visitation, and per capita spending – in turn.
Annual Visitation
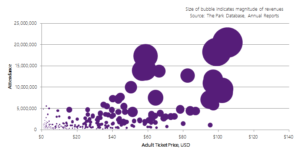
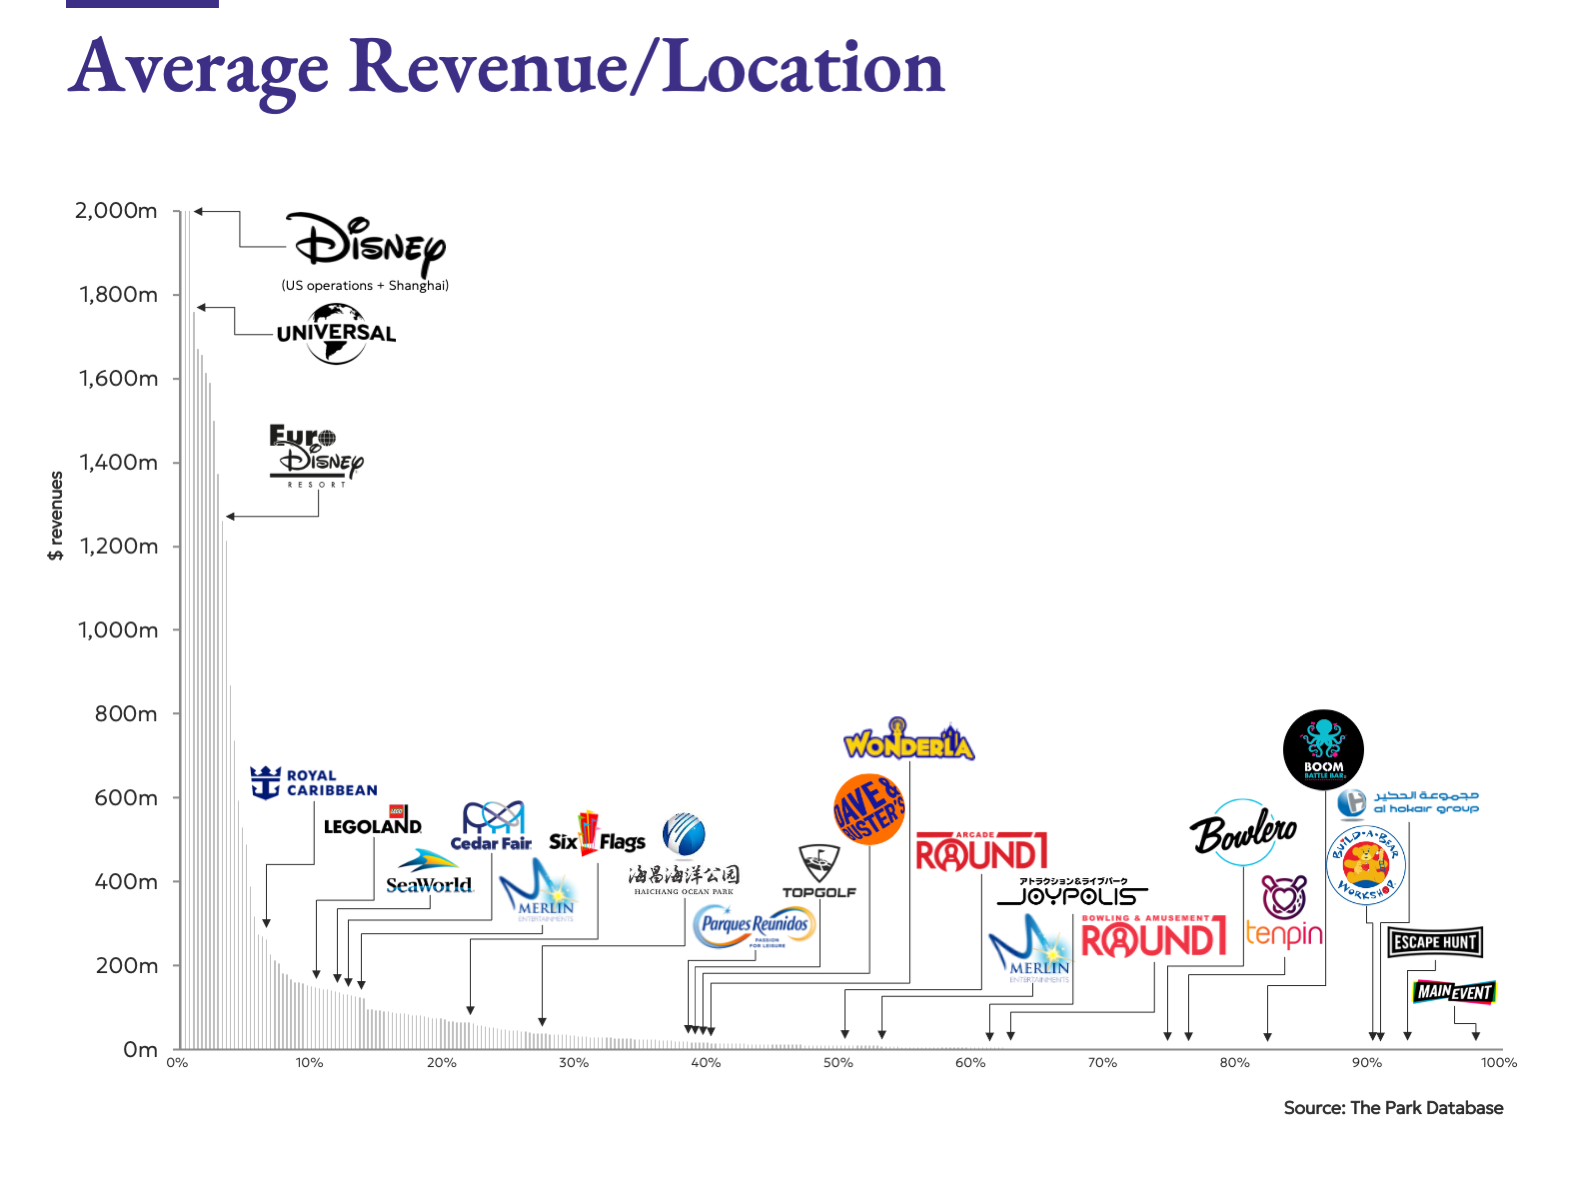
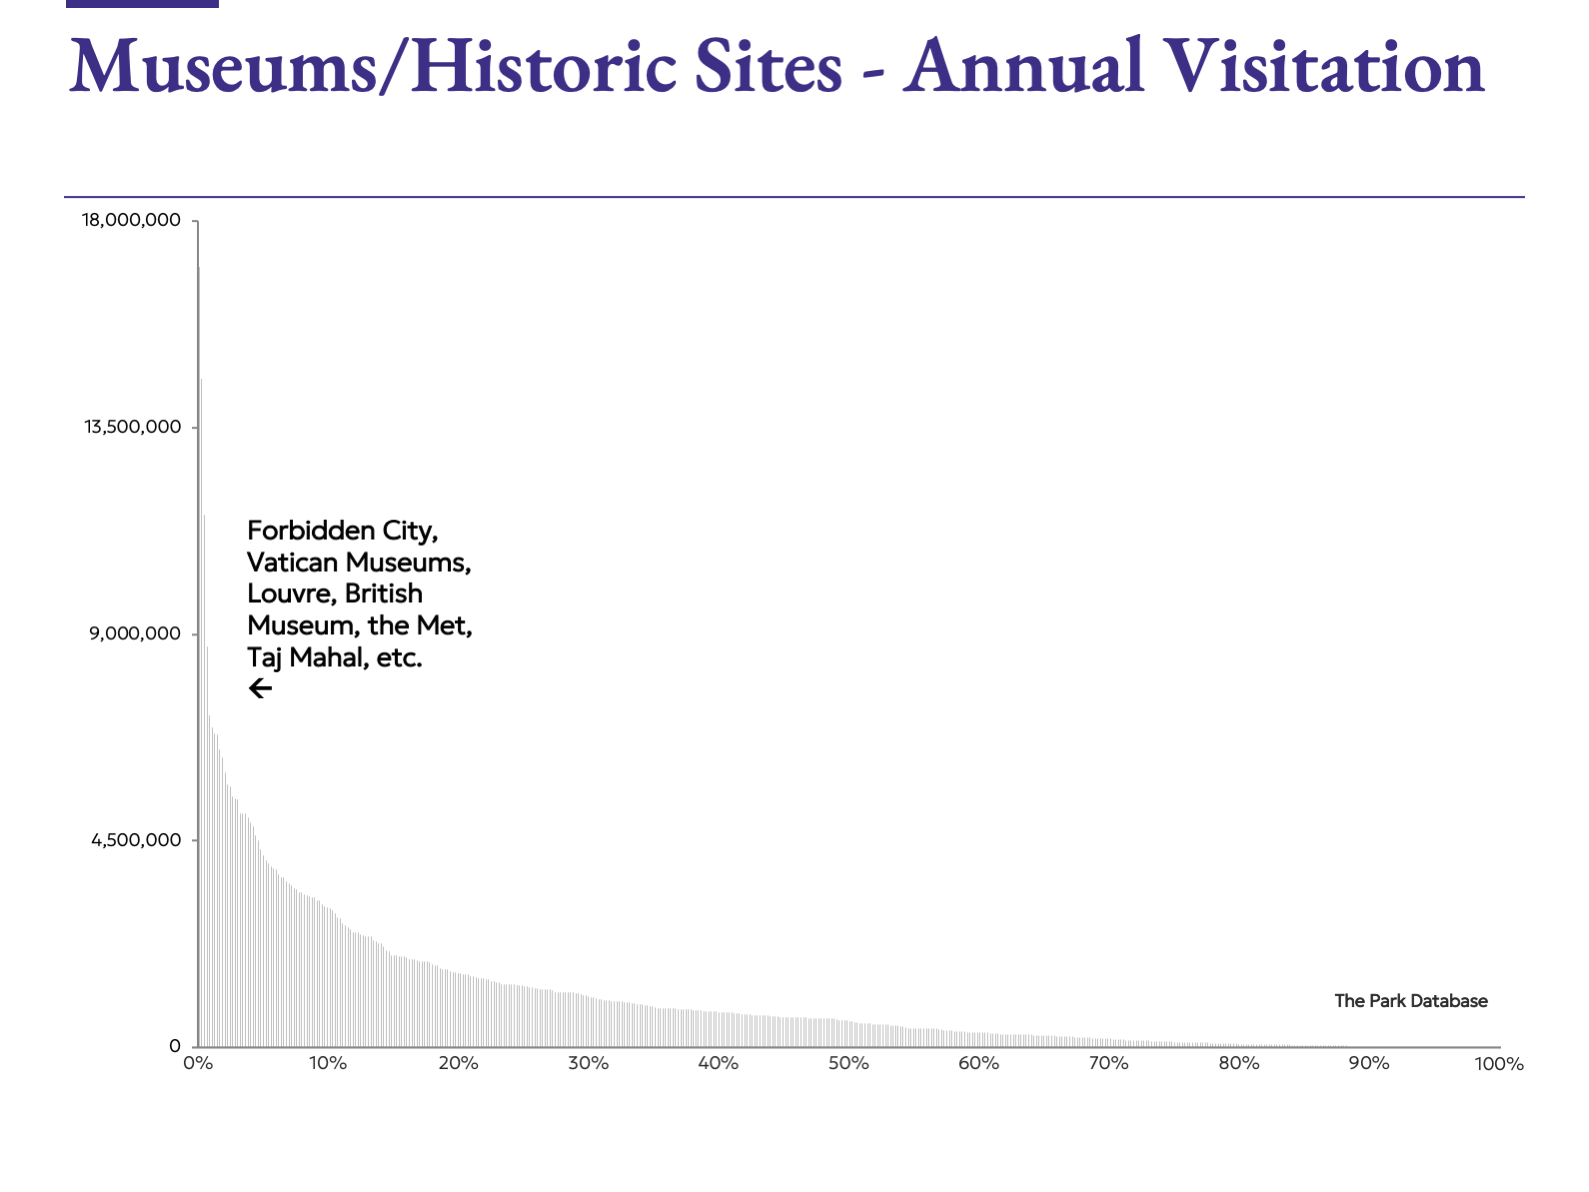
When it comes to attendance, true scale is rare. For example, only a handful of attractions worldwide exceed 10 million annual visitors, and even surpassing 5 million in attendance places a theme park among the top ~30 parks globally, representing just 10% of the theme parks in our dataset.
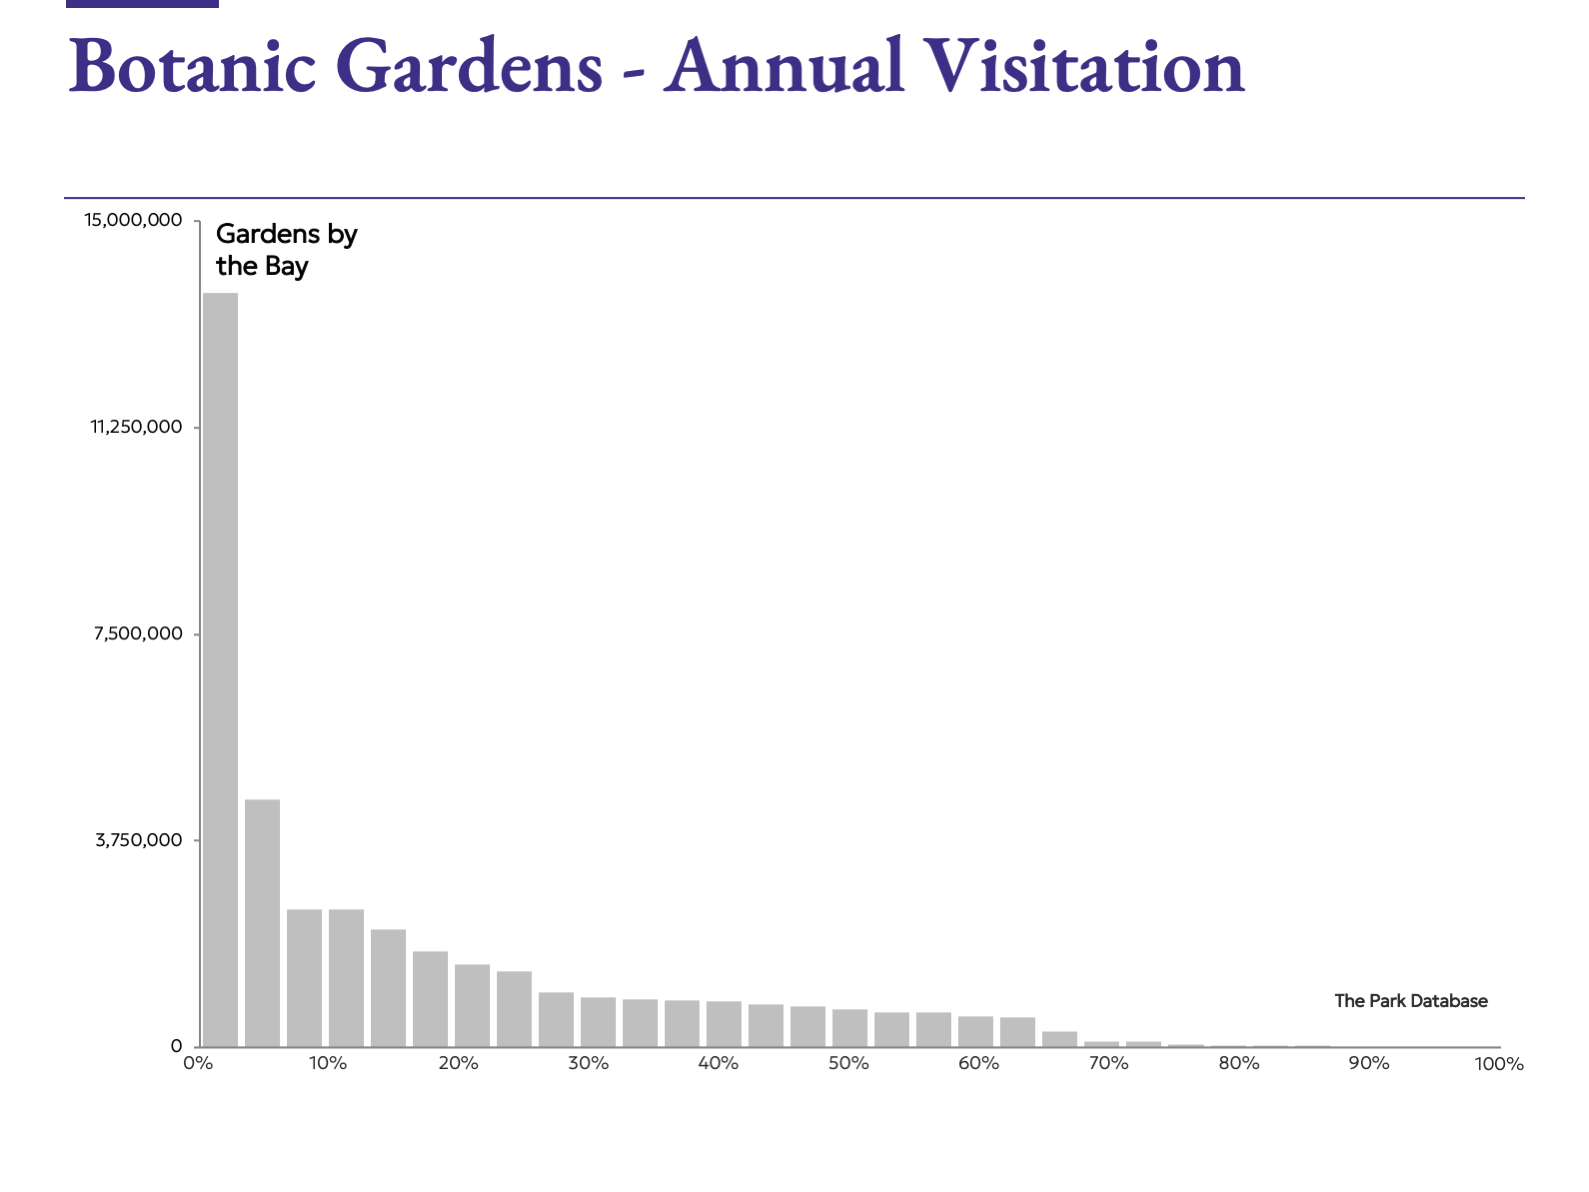
This pattern holds true across the spectrum of both commercial and not-for-profit attraction types. Beyond outdoor theme parks, indoor parks, FECs, museums, botanic gardens, historic landmarks, and waterparks all exhibit the same long-tail characteristic – at the top, a tier defined by outliers, followed by a flat part of the curve.
What accounts for this pattern?
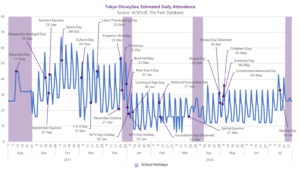
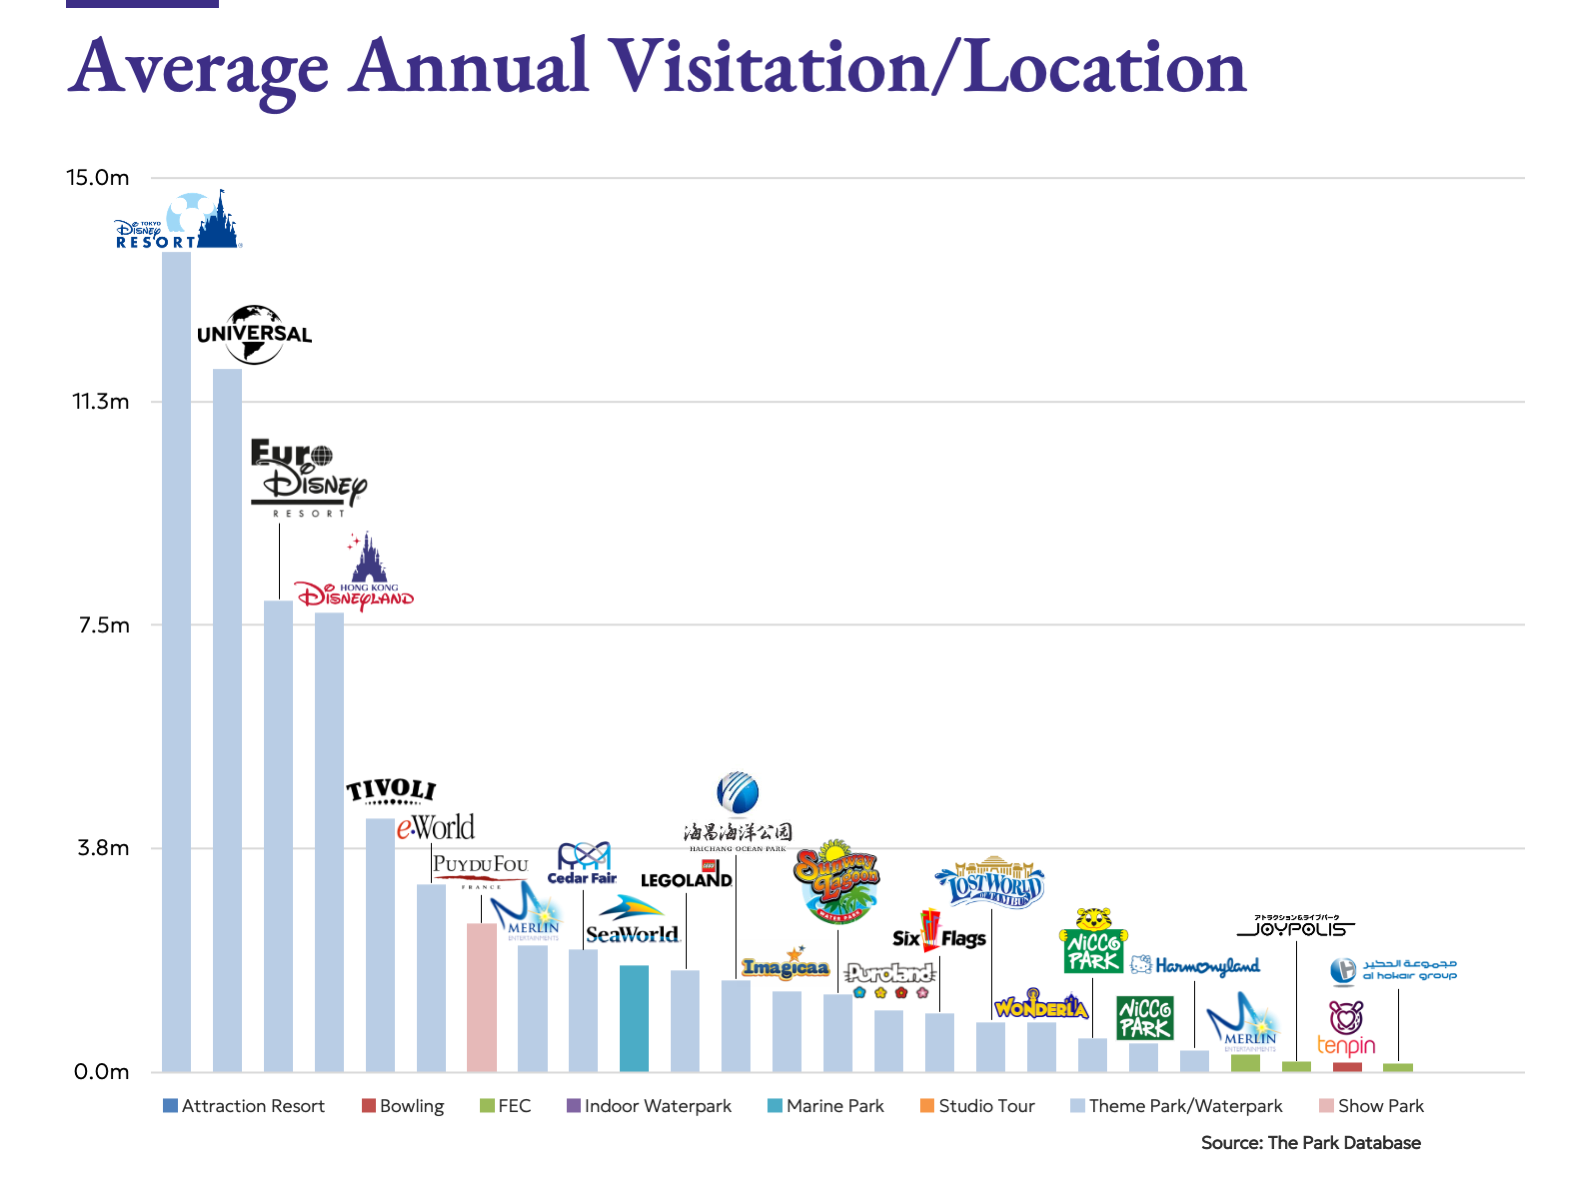
The Long Tail – In regards to the flat part of the curve, this is likely due to constraints. For most attractions, attendance is constrained by a combination of capacity limits, seasonality, and demand peaking. Attractions might operate at or near capacity on a limited number of peak days, such as holidays, school breaks, or major tourism seasons – but will experience visitation well below full utilization during the rest of the year. As a result, simply expanding physical footprint does not automatically translate into higher attendance. In other words, “supply” is not the limiting factor; it’s demand.
The Outliers – But what accounts for the outliers? Outliers exist in every distribution, but in attractions they tend to reflect structural advantages rather than incremental improvements. These include exceptionally large capital bases, long-term brand compounding, irreplaceable locations, or cultural singularity. While every attraction is idiosyncratic, the reasons for exponential outperformance are even more so.
Now we’ll take a more detailed look at each type.
Theme Parks: Capital, Brand, and Time
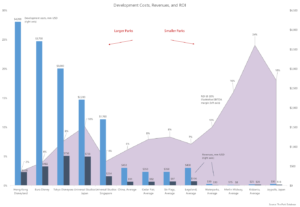
As we detailed previously, the theme parks that dominate attendance charts are also the ones capable of investing a billion dollars or more into a single property. Namely, Disney, Universal Studios, and Chimelong. A similar investment-driven dynamic appears in the botanic gardens category as well: Singapore’s Gardens by the Bay represents a billion-dollar civic statement designed to symbolize an entire city.
But capital alone is not sufficient. The reason these operators can deploy such capital today is that their parks were built into dominant enterprises over decades through patient brand building and long-term reinvestment. Operators that pursued shorter-term strategies rarely accumulated the same compounding advantages.
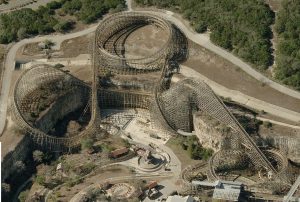
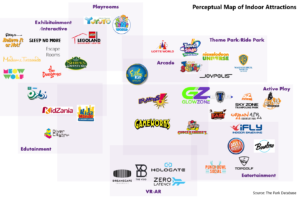
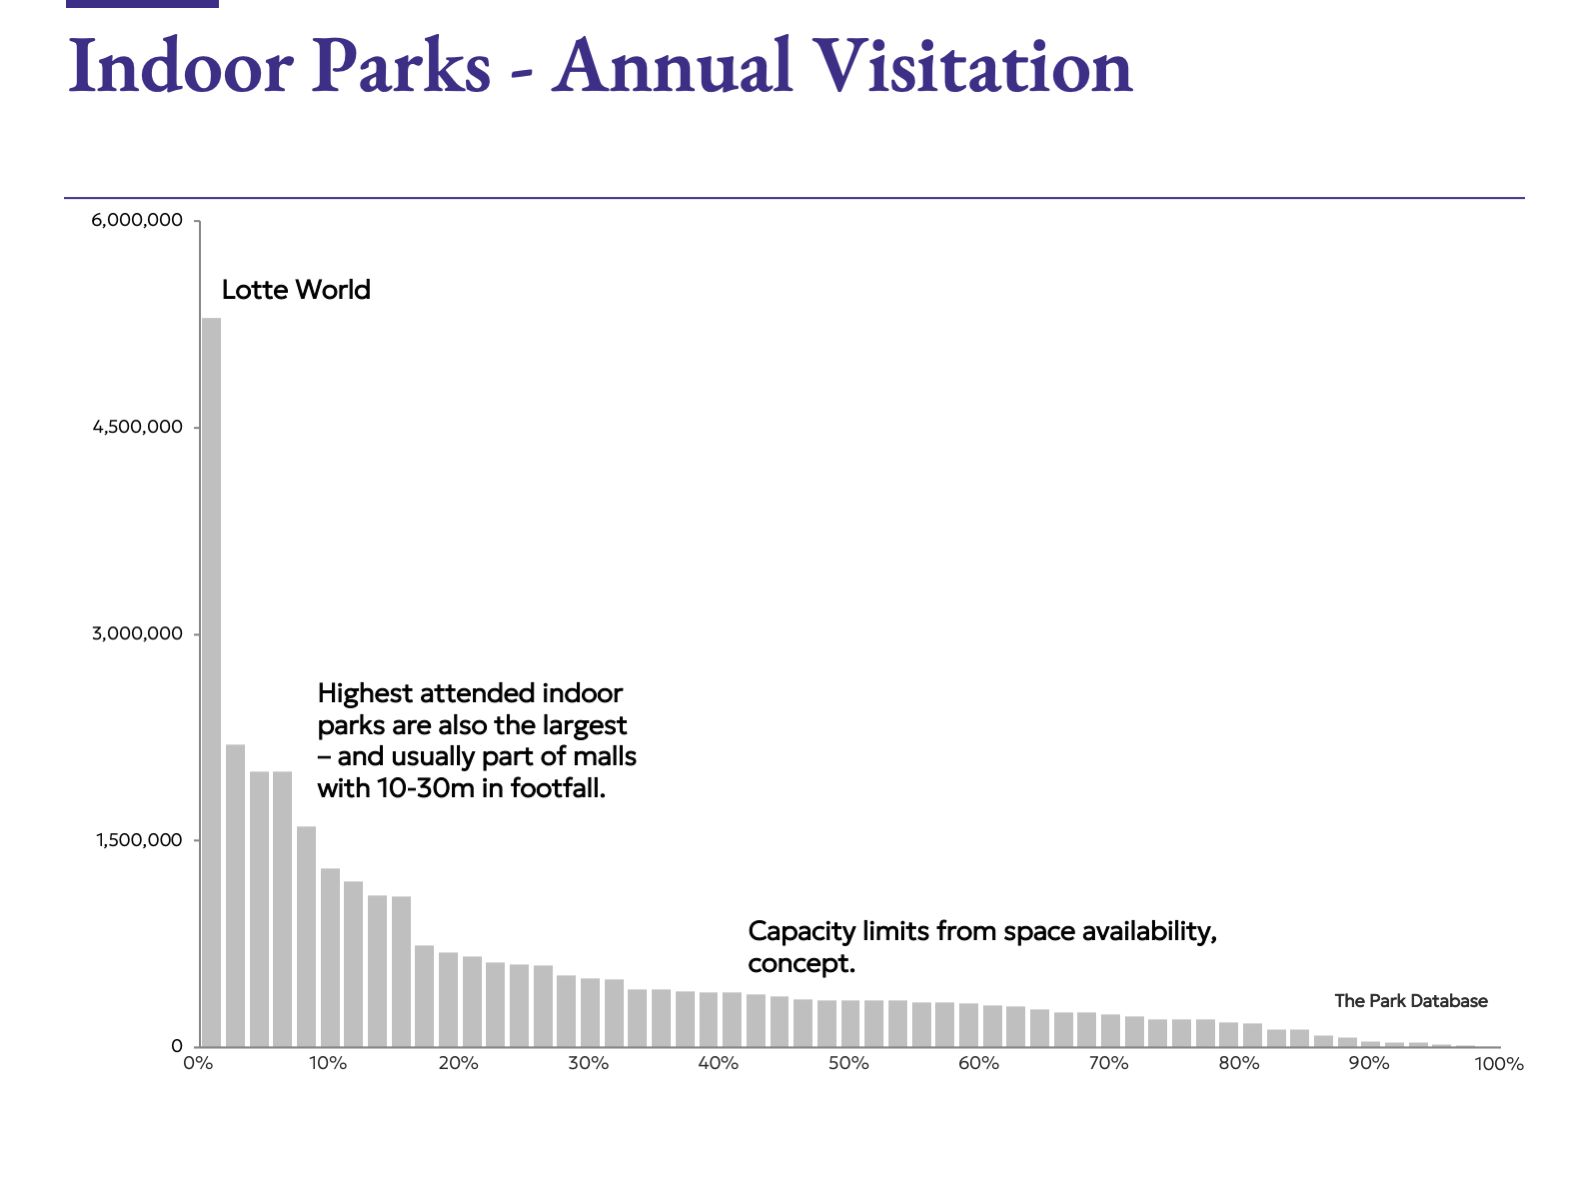
Indoor Parks: Size as Destiny
Indoor parks introduce a different constraint: enclosure. After investing in both the land and hardware, deciding to build a massive, climate-controlled shell adds yet another level of complexity, risk, and cost. As formats shrink further, such as into immersive attractions, fire codes, timed entry systems, and experience design enforce strict capacity ceilings.
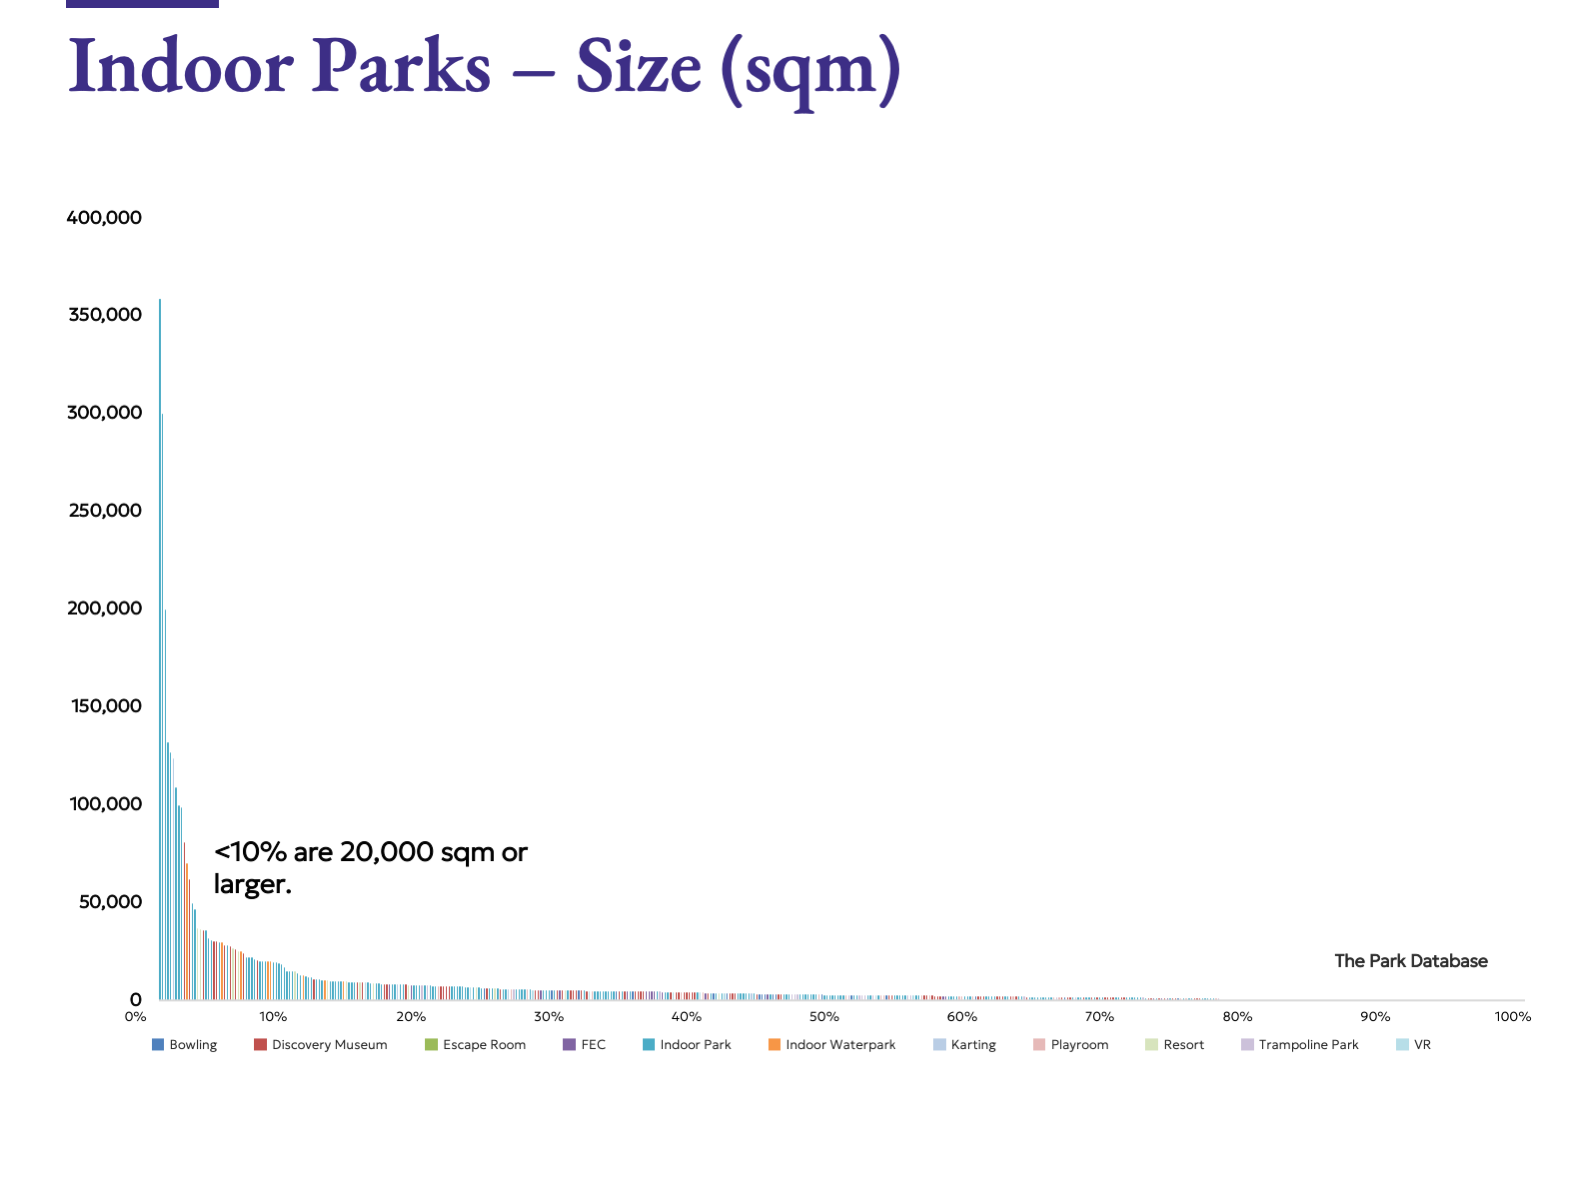
Therefore, size is the dominant differentiator. The highest-attended indoor parks are those occupying 20,000–50,000 square meters (220,000–550,000 sq ft) or more. Today, the limiting factor is rarely construction capability but rather the cost of space or occupancy adjacent to dense urban markets.
This helps explain why many of the largest indoor parks are part of enormous mega-developments, integrated with retail, hotel, transit hubs, and other mixed-use districts: Lotte World’s eponymously named mall, Moscow’s Dream Island, Mall of America’s Nickelodeon Universe, and Indonesia’s Trans Studio being just a few examples.
Of these, Lotte World is the runaway winner in this regard: its early investment in a location just above one of the highest trafficked subway stations in Gangnam, Seoul, has compounded alongside Korea’s urbanization and economic growth, producing the highest recorded attendance for any indoor park globally.
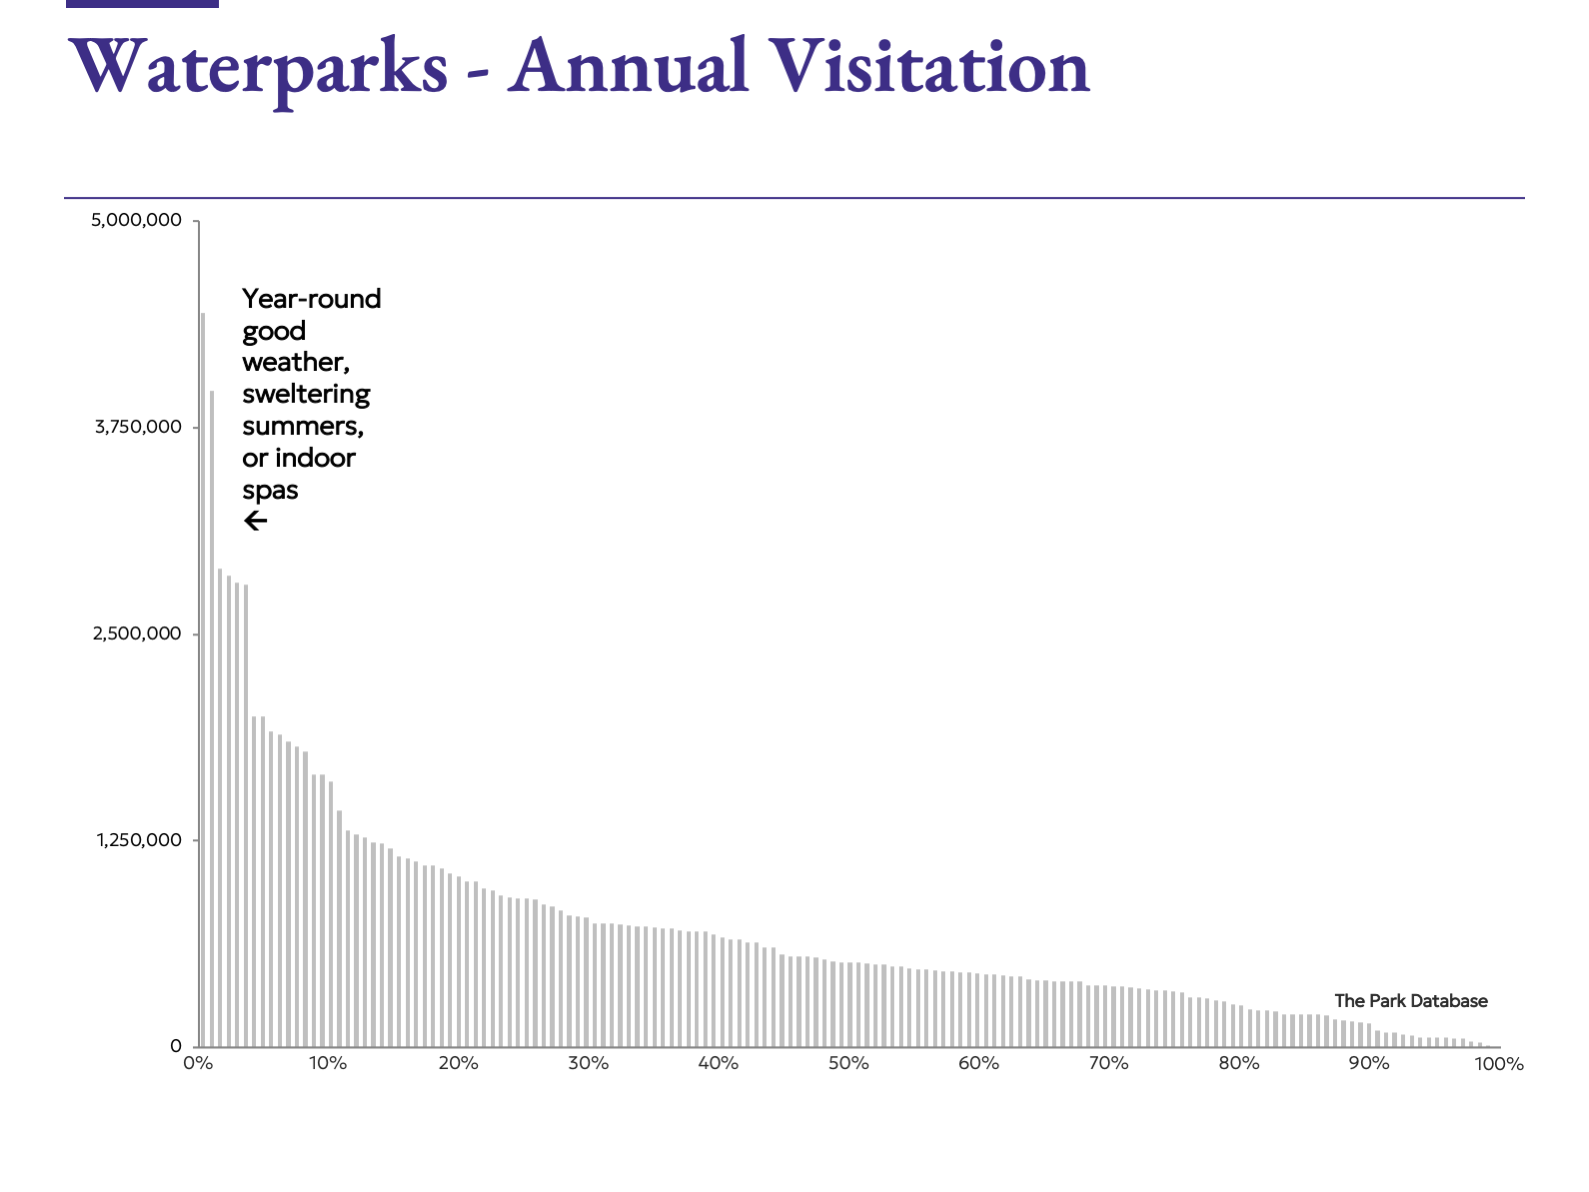
Waterparks: Climate over Brand
Waterparks present a notable contrast to theme parks. Branding and intellectual property appear to exert far less influence at the top end of attendance. While Disney and Universal waterparks do rank highly, the world’s most attended waterparks are largely standalone or resort-based parks unaffiliated with global brands.
By and large, the attraction mix for waterparks is more standardized than in other attraction types, with a mix of slides, pools, rivers constituting the majority of the attraction offering. This places a greater emphasis on product-market fit and location. The highest attended waterparks in the world are in locations with nearly year-round warm weather or extreme summers, such as Dubai, the Bahamas, Brazil, and southern China. In colder climates, the most successful “waterparks” often incorporate hot springs or spa components to extend operating seasons.
Museums & Historic Sites: The Singular
For all the attraction types covered here, visitation to the top museums and historical sites is the clearest reflection of the unequally distributed nature of the ‘unique’ and irreplaceable. There is only one Mona Lisa, one tomb of the Qin Dynasty founder, one Vatican, one Taj Mahal. That is what’s reflected here.
For a free list of the top attended theme parks, waterparks, and museums around the world, be sure to download the TEA Global Experience Index.
For a historical dataset encompassing several hundred attractions of every sort around the world, consider our attendance data download.
Per Capita Expenditures: Narrower Range, Similar Pattern
Now for the second product of the equation. Per capita spending follows a similar distributional pattern, though within a tighter band than attendance.
Very broadly speaking:
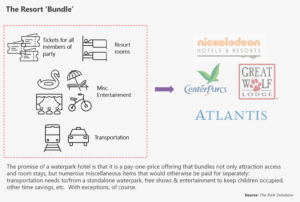
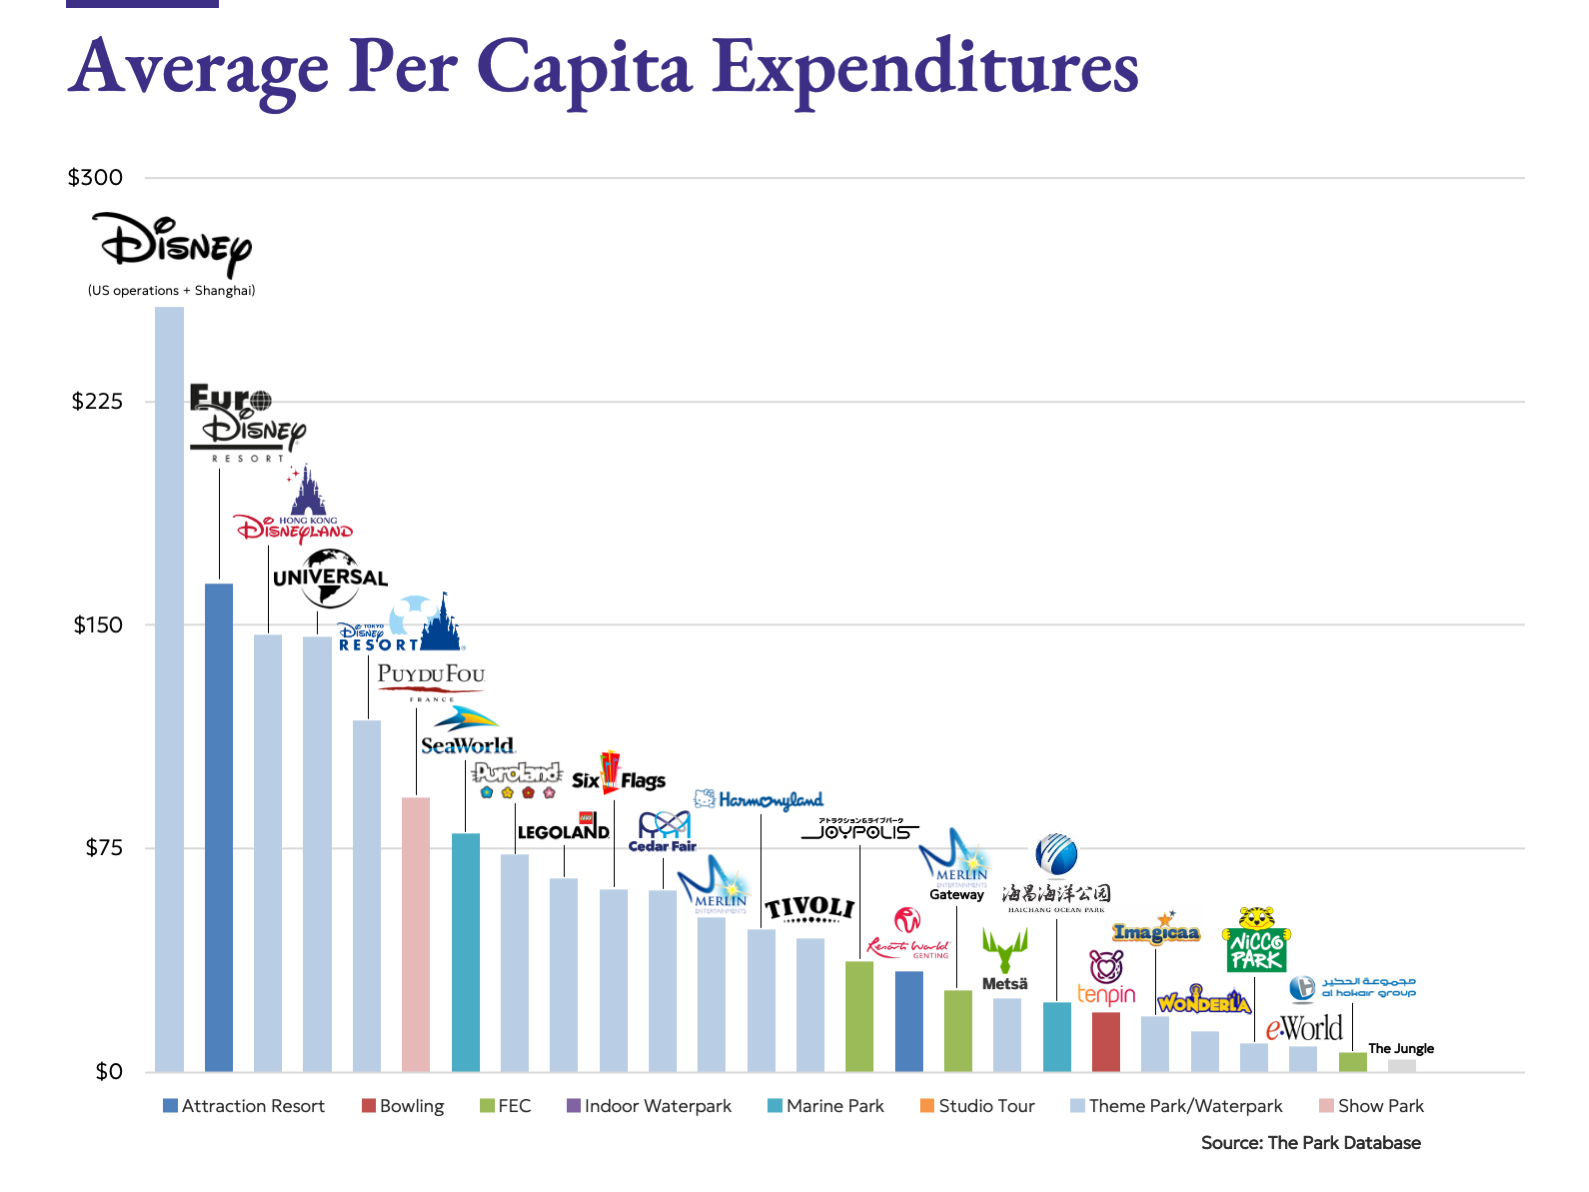
- Megapark spending is at least $100-150 per visitor. This is the realm of Disney and Universal Studios. Per caps are even higher in true resorts where the figure includes hotel accommodations.
- The next tier are superregional parks, and the other largest chains in the world not named Disney or Universal Studios, with a threshold of about $60. This is the tier of Legoland, Six Flags, regional parks in Japan and Europe.
- Regional operations and ride parks around the world average $40-$60 per visitor. Top parks in East and Southeast Asia are in this range.
- The largest indoor operations range from $20 to $40.
- Less than $20 would be smaller attractions and the largest attractions from emerging markets like India.
These comparisons are illustrative, and should be interpreted on a relative basis. Converting all prices to US dollars standardizes at the expense of some distortions. At purchasing price parity, for example, India’s per cap expenditures would be closer to $40 in dollar terms.
A more revealing metric of a park’s performance relative to its own potential and within its own market is yield: total per-capita spend as a ratio of headline ticket price. High-performing attractions often generate ancillary spending equal to 50–100% of ticket price, reflecting strong pricing power and guest engagement. At the opposite end, some attractions rely on heavy discounting or group sales, effectively subsidizing their visitors, resulting in yields well below ticket price.
When it comes to ancillary spending, length of stay is the key driver. Longer visits increase food and beverage spending, retail exposure, and impulse purchases. The ultimate prize is overnight stays, where per-guest revenue can reach into the hundreds or thousands of dollars. As Disney lore has it, Walt Disney’s central insight was precisely this relationship – noticing that Disneyland topped out at a seven-hour visit; he then designed Walt Disney World to extend the seven hours to seven days.
Revenue Mix: Tickets First, Everything Follows
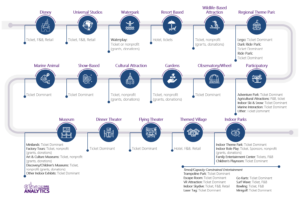
In general, the majority portion of revenues for all attractions are from tickets, or admissions. The attraction industry in general is the business of gating a spectacular amusement, ride, show, or exhibit, and charging for access. This distinguishes it from non-profits or museums, where the majority of revenues are usually from donations, grants, or endowments.
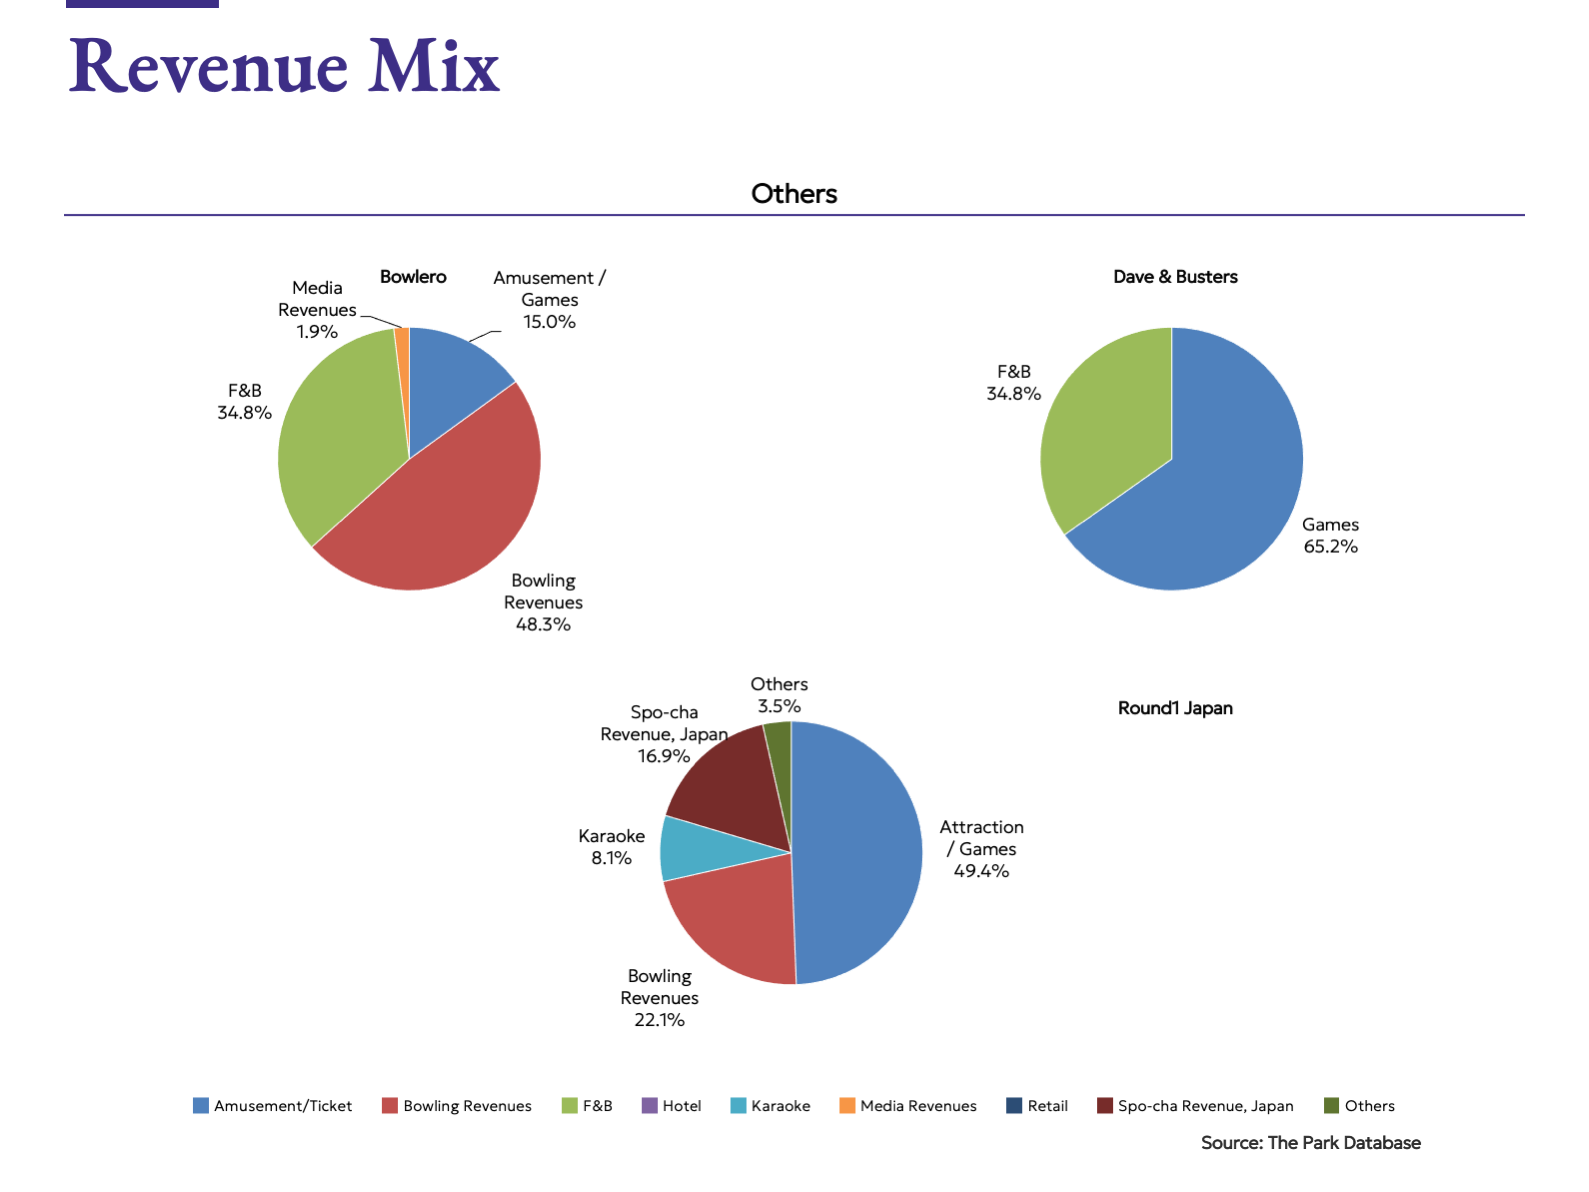
This is true across the range of types, from theme parks to waterparks, marine parks, immersive museums, and even experiential retail such as CAMP, which reported that ticket sales to its events comprised half of revenues. This is true even for competitive socializing attractions such as Bowlero or Dave & Busters, where restaurant and bar operations might appear to be just as important as the games themselves. In both cases, the fare paid for the attraction (games, bowling) is the majority share of revenues.
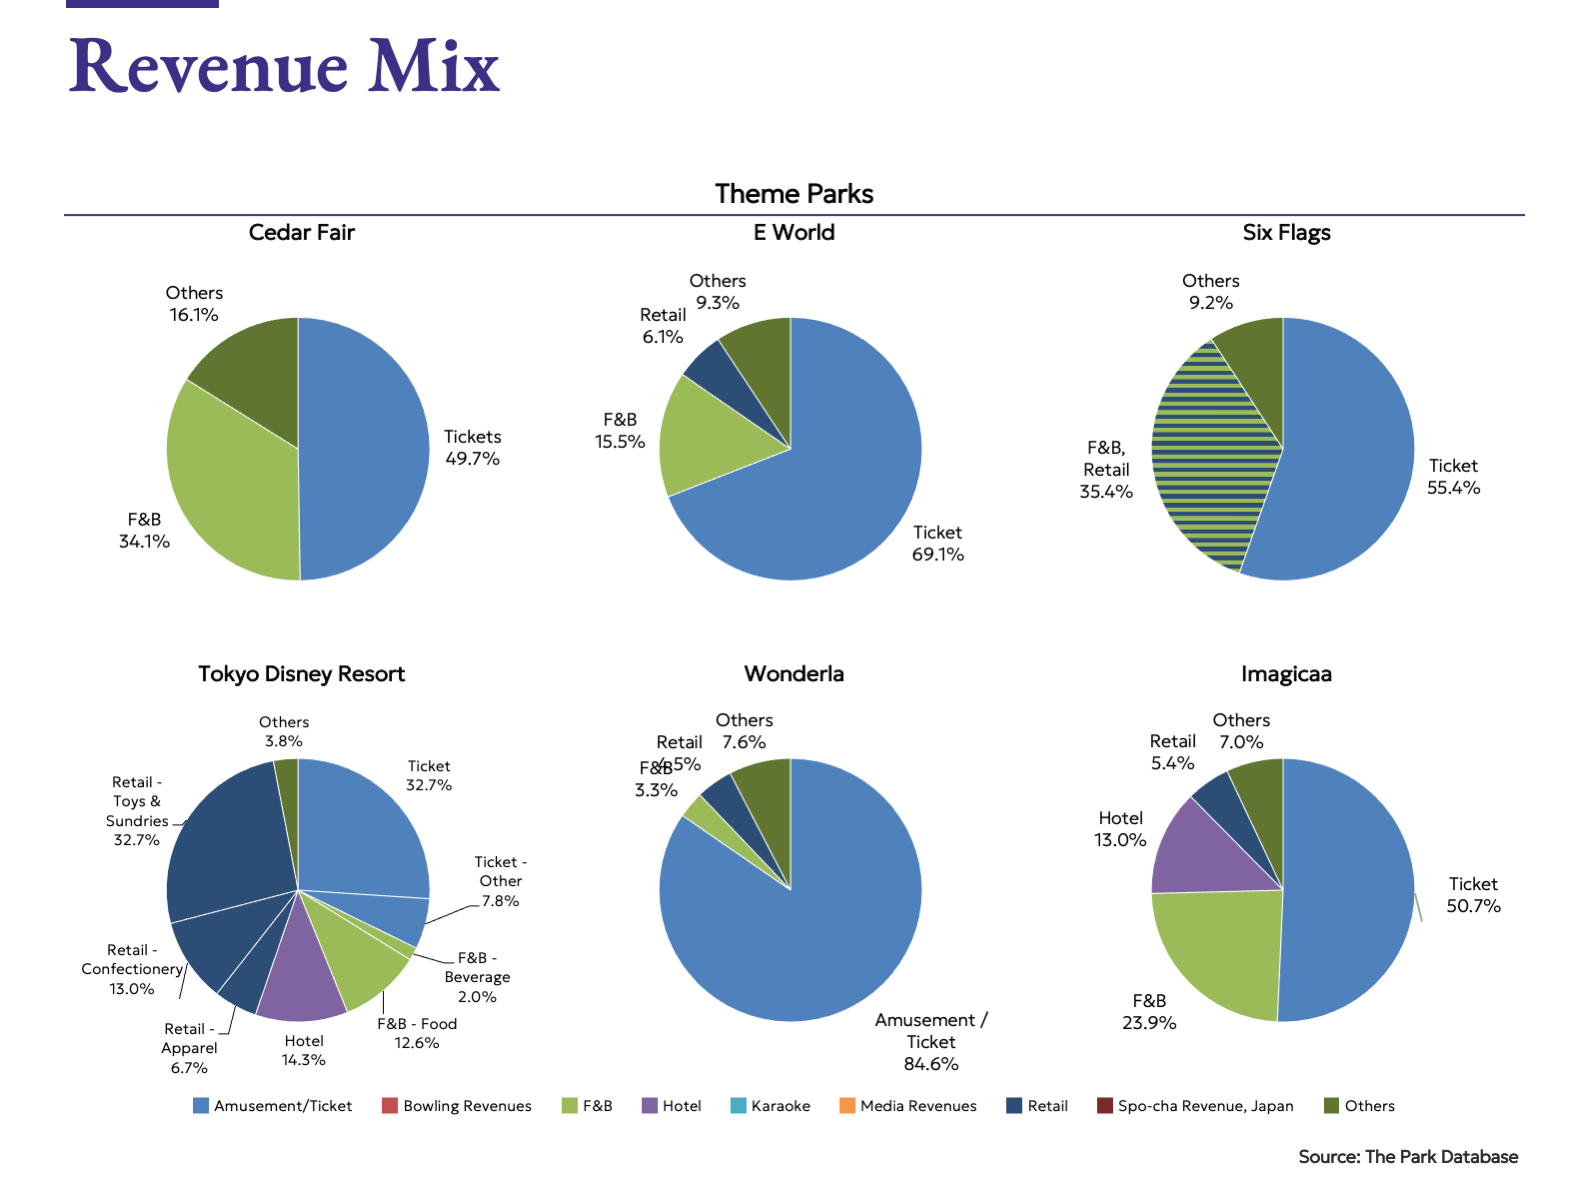
F&B: the most common secondary category, and highly correlated with lengths of stay. Attractions that can induce visitation over mealtimes fare better, but there are categories of food service-first attractions where food is approximately half of all revenues. Now commonly called competitive socializing, these are venues that combine food service with games, and span the range from child-centric attractions like Chuck E. Cheese’s to Topgolf.
Retail: this is a category of spend for souvenirs, and a measure of how connected guests have been with the experience. IP, brand-driven attractions fare well here. Note that the majority of Tokyo Disney’s spending (51%) is from retail sources – toys, sundries, confectionery, and apparel!
Other: a catch-all category with meaningful variance among attractions. Highly visual, themed spaces are able to derive significant revenues from event space and rentals. Rental income from strollers, transport, miscellaneous services. Sponsorship revenues are a tried and tested strategy dating back to the earliest theme parks.
Summary
The economics of attractions are shaped by constraints: in capacity, climate, capital, and time. Attraction attendance, guest spending, and total revenues all exhibit long-tail patterns because only a few attractions of each type possess the rare combination of scale, location, brand, and longevity required to escape those constraints.
As we like to remind clients, success is not just about chasing the top of the curve, but about understanding where on the curve they realistically sit, and optimizing within that reality. For the rare few at the top, the lesson is equally clear: dominance is not built in a single investment cycle, but compounded patiently over decades.
Understanding these dynamics is essential not only for evaluating existing attractions, but for making informed decisions about what kinds of attractions should be built in the first place.
Looking for the source data? Purchase the entire dataset here.