Revenues: Not Created Equal
Revenues are the starting point for all cash flows. While revenues can be disaggregated into its components, attendance and per person spending (subjects of a later post) – for our purposes, a high level view will suffice.
Using data from the Park Database, we’ve plotted the distribution of theme park revenues for over 300 parks in the world. These are theme parks for which attendance numbers are readily available, and revenues can either be observed directly or estimated with a degree of confidence.
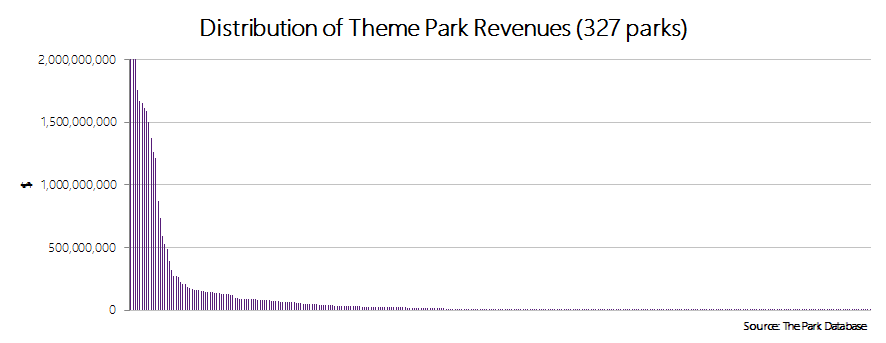
Far from being a random distribution, it turns out that like many (most?) financial outcomes in the world, the amount of money theme parks make also conforms to a power law. Less than 5% of theme parks in the world make more than a $1 billion in revenues. In this chart, 20 theme parks are responsible for more than 90% of the revenues.
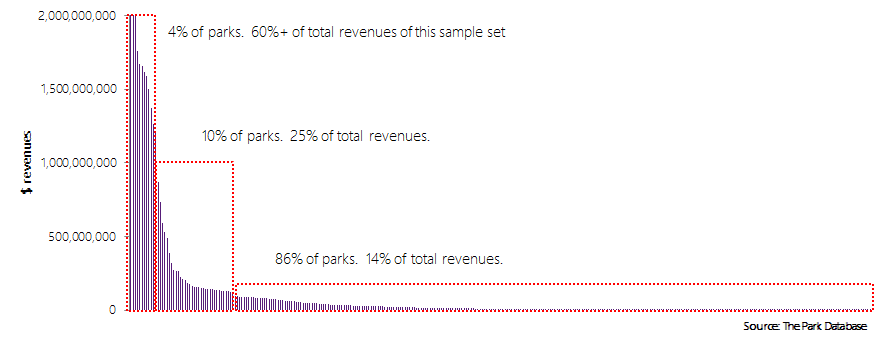
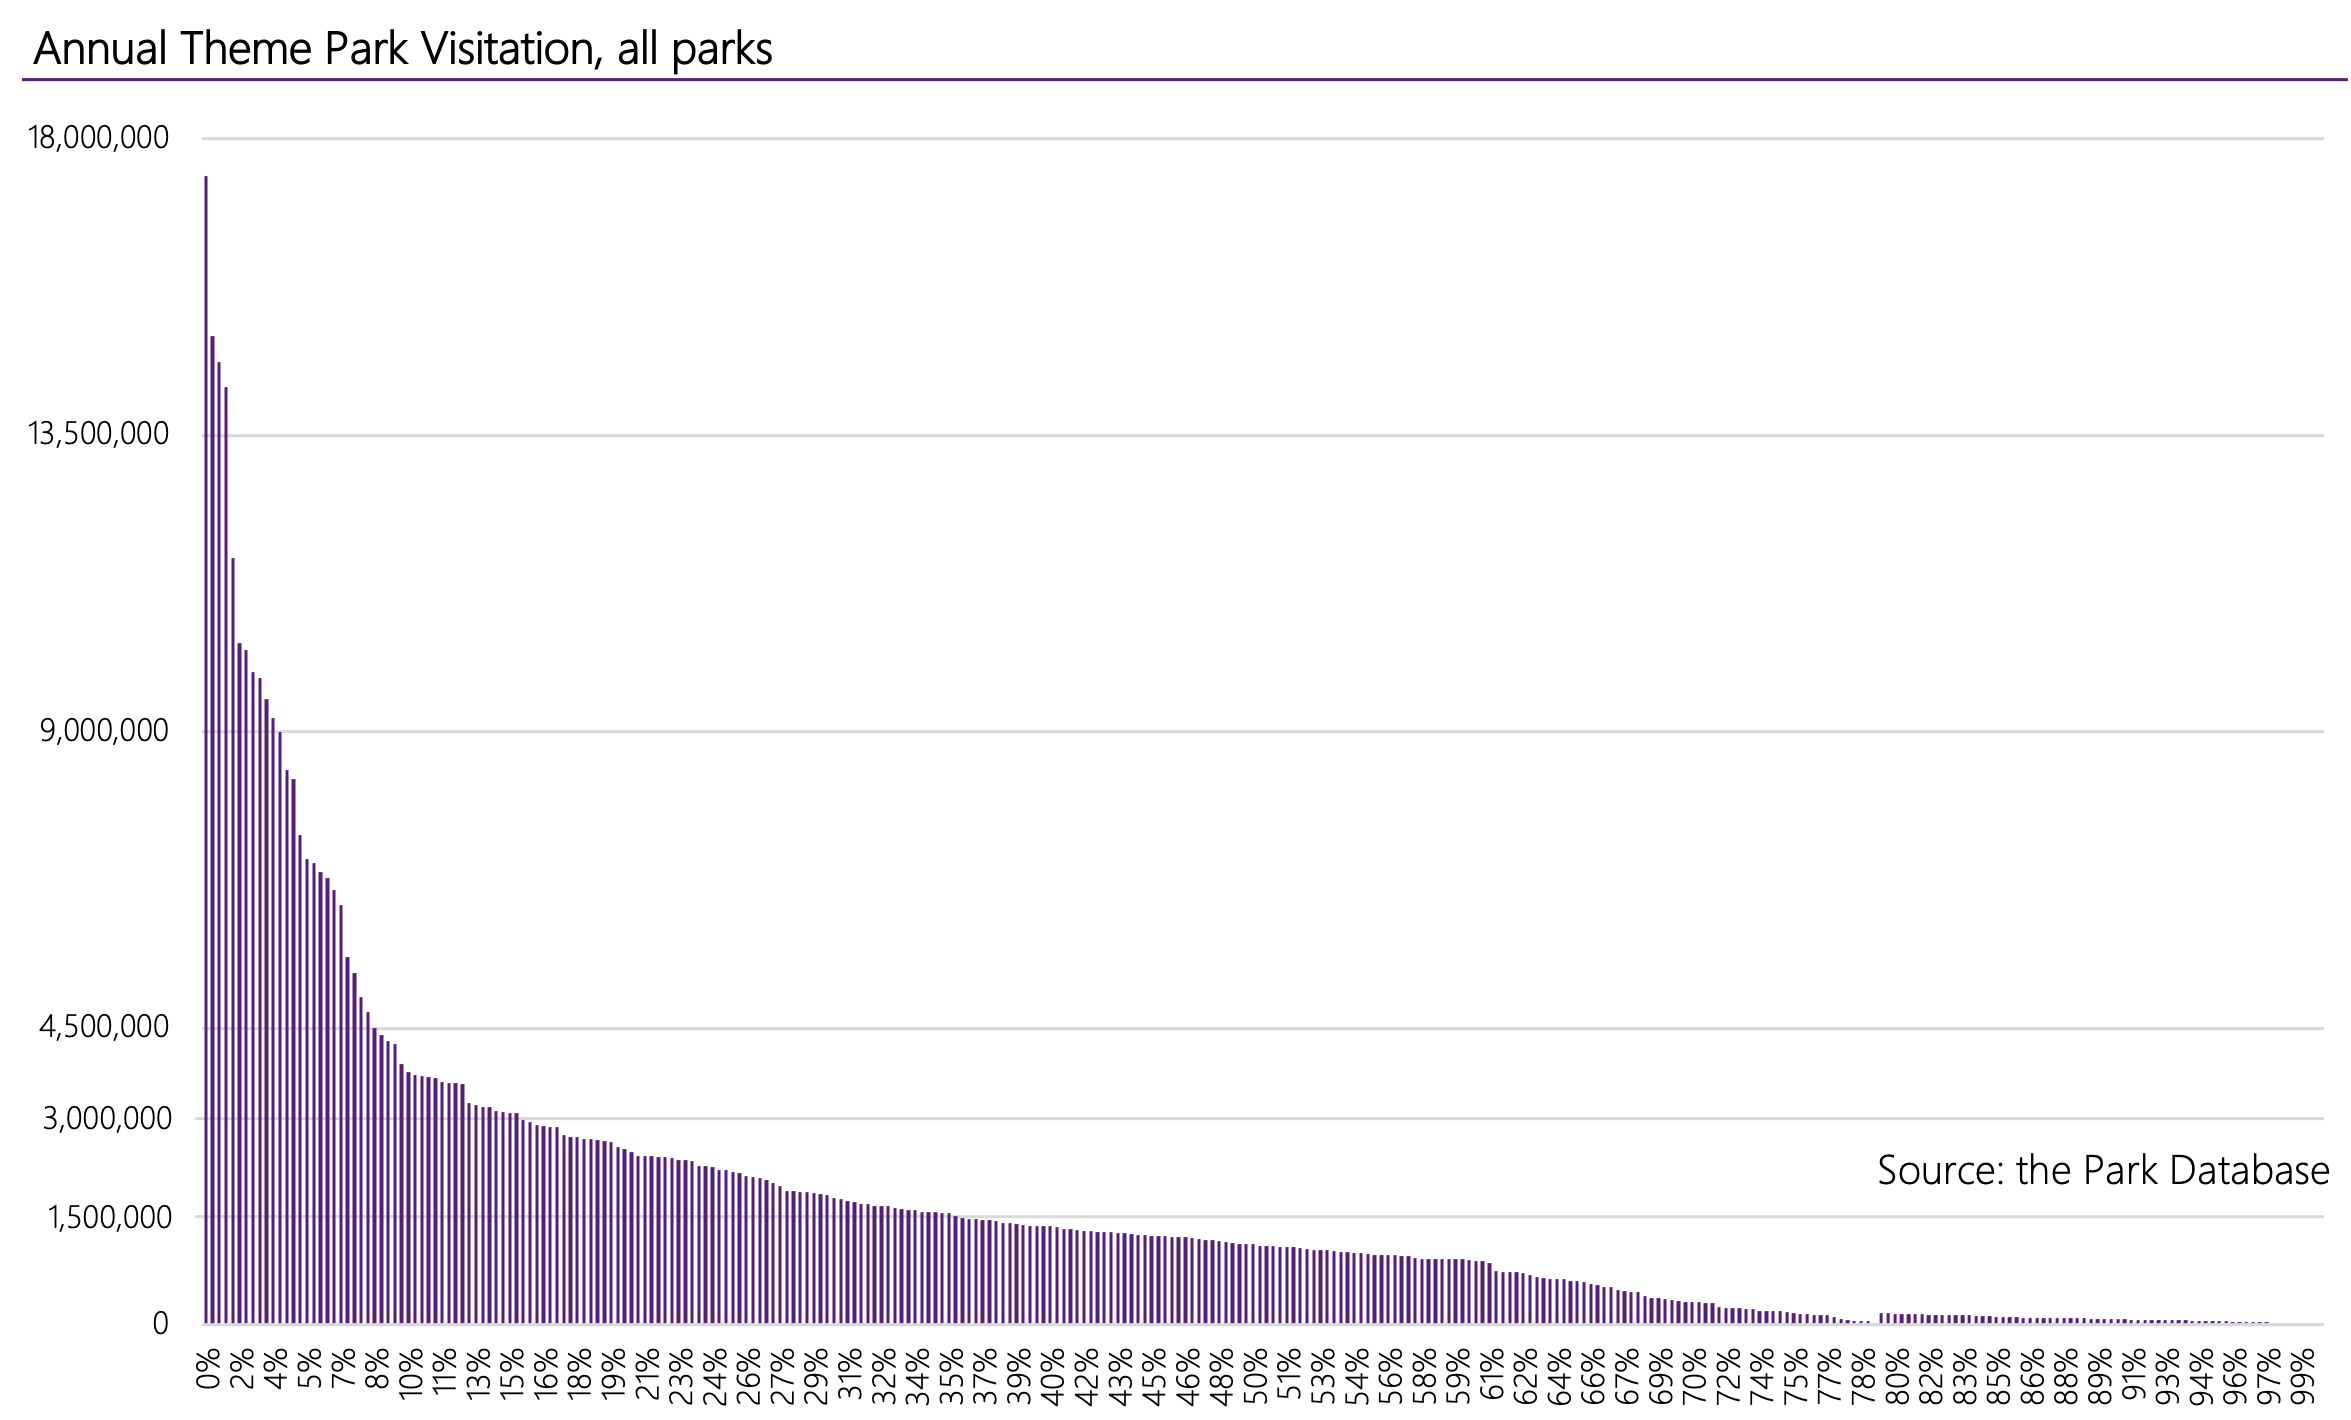
This distribution rises from the fact that the components of attraction revenues are essentially: attendance x per capita guest spending, and attendance is also arranged in a power law distribution. Read more about it here.
There are several implications of this power law distribution, but for our purposes, you can understand that the theme parks of the world can be classified into a handful of revenue segments.
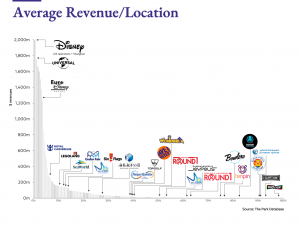
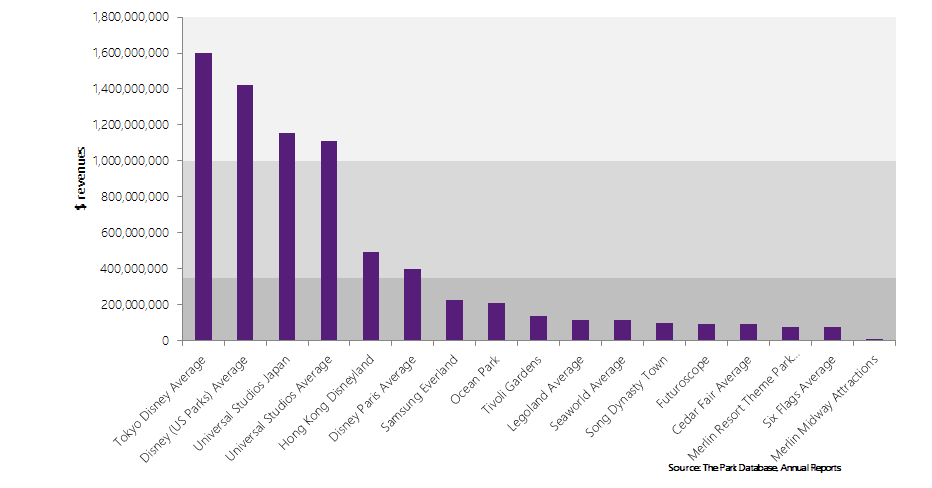
Let’s get more concrete. Using publicly available data, we can list specific parks and their individual or average revenues.
This small sample includes the highest attended and famous parks in the world. Even so, their revenue figures are completely unevenly distributed.
To call out some points and pre-empt your objections:
- What do these charts tell us? That essentially, in the world of theme parks, there is the Disney/Universal category, and then everyone else. Consider that Ocean Park (Hong Kong) is more highly attended than Hong Kong Disneyland, but has a revenue level that is 50% of the latter. Samsung Everland is among the highest attended theme parks in Asia, but is also squarely in the lower tiers in terms of revenues.
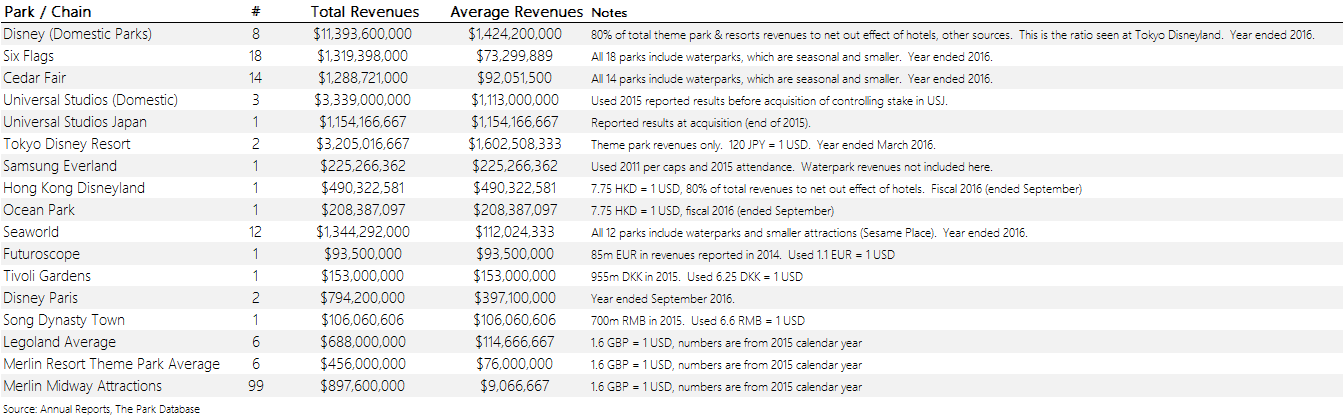
- Average revenues for chains/multi-park entities were calculated by dividing by the total number of parks, which included in many cases, seasonal or smaller operations such as waterparks or indoor attractions – Cedar Fair, Six Flags, Seaworld. What is important to note here are rough orders of magnitude, not the exact amounts. Even if these seasonal operations were excluded in the denominator, the average would not be much more than $100 million – in all three cases.
- We are entirely cognizant, and in fact believe there is a strong probability, that Cedar Fair, Six Flags, and Seaworld each have top performing parks that are in the $200-$400 million range. However, this also means that they have several parks that are much less than $100 million in revenues.
- As a corollary to the first point, while attendance is an important metric in terms of planning and sizing, there is a weak correlation between it and cash flows. Revenues are the more important factor when considering the theme park as a business, rather than as a gift to the people, which some of these parks are.
- There are famous theme parks that are missing in this chart. We’ve only focused on publicly available revenues.
For more detail on the methodology, see below; for a complete methodology, please contact us.
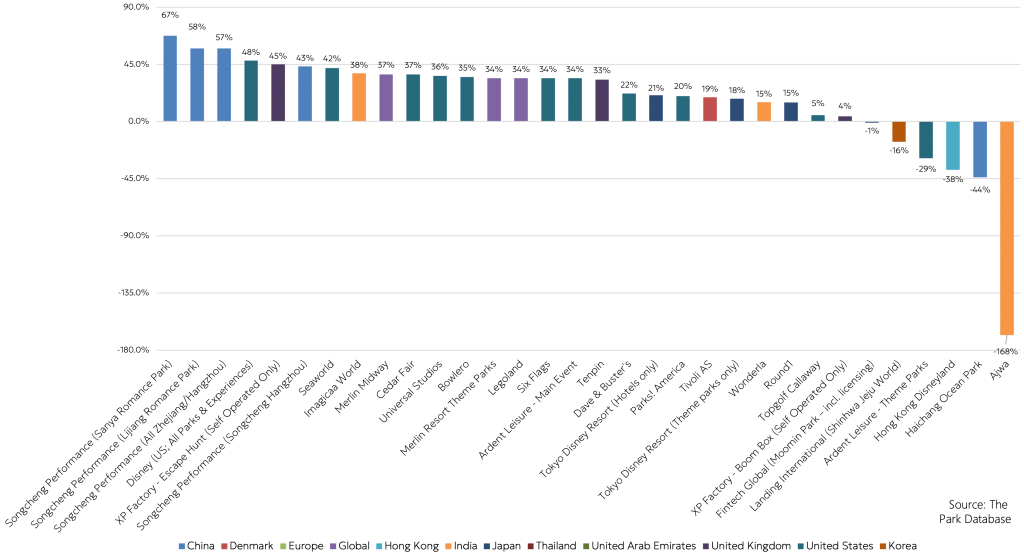
2024 update: while the above data are from the pre-COVID era, the underlying principles are essentially unchanged. Here’s a chart of values from 2022 across a range of types.

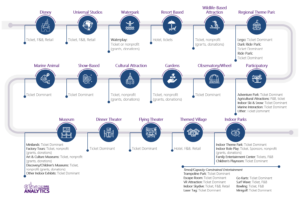
Revenue Categories
You might observe several distinct categories here.
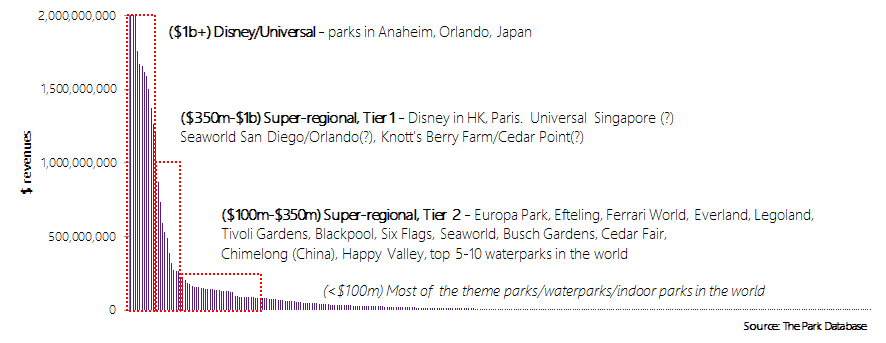
Disney/Universal
Disney and Universal operate the only billion dollar parks in the world (2024 edit: while this was true at the time of writing, Chimelong Ocean Kingdom has almost certainly passed the $1b mark).
It’s unlikely that in the foreseeable future, there will be other parks that can match them in terms of revenues. Not impossible, just unlikely. This is as a result of several factors:
- Both parks generate billions, but spend billions to get there. Consider the development cost of the last two Disneyland parks; Hong Kong at $4.5 billion, or Shanghai Disney at a reported $4 billion. Obtaining funding in this magnitude, for unproven concepts, is prohibitive; i.e., it’s not 2007 anymore.
- Moreover, spending the billions is no guarantee of success. The factors leading to success in the theme park business are ill-defined. As much as consultants will tell you they know what to do, each park’s market dynamics are impossible to predict. The best thing you can do, as a park developer, is to approach this as a risk management exercise and limit your downside. Euro Disney is struggling to generate profits almost 30 years after opening, while Hong Kong Disneyland has been cash flow positive and net income negative.
- Disney and Universal have first mover advantages. Big moats. This comes in two forms. First, compared to when many of these theme parks were built, the world has urbanized to an extent – and central banks have so pushed up asset prices (i.e. land) – that being able to marshal the resources to purchase the minimum of 15-30 hectares of prime land next to a large metropolis, is an unbreachable goal, for most. The first parks for both Disney and Universal were built in 1955 and 1964, respectively.
- Also, to compete head to head with either Disney or Universal will require you to outspend them. In their competitive response, however, they merely have to add a new ride or attraction. When Disneyland was built in the 1955 for $17 million, which adjusted for inflation would still be under $200 million dollars, its cost was way under the threshold you would need to spend in 2017 to just be on par with peoples’ expectations. By being first it had the advantage of not needing to completely fill the park with content, just to catch up to the existing level of peoples’ expectations.
- For both Disney and Universal, their theme parks are a location-based delivery system for the rest of their media business. Not entirely coincidental to their theme parks’ success is the fact that both brands of parks are owned by media & entertainment conglomerates with television, movie, and other media properties that allow cross-pollinating (let’s use this word instead of synergy) business models between their theme parks and the rest of their assets. This cannot be underemphasized. Walt Disney recognized this in 1957.
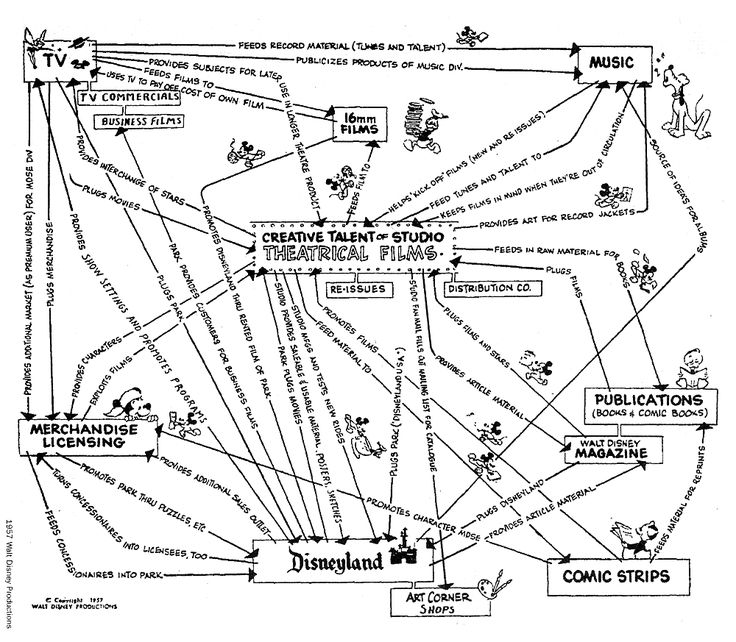

The key takeaway here: Don’t hope for getting Disney or Universal attendance, or revenues, if you’re not prepared to spend as much as them, and if you don’t have the media reach / mindshare as they do. This is a key point we have to repeat while working in places like, say, China.
Super-Regional Parks
You can divide this category of parks into two tiers. This category is an almost absurdly wide range of revenues, but the fact is that this category doesn’t actually have that many parks in it!
Tier 1
The first tier generates between $350 million to $1 billion in revenues. We could also refer to this category as Disney/Universal-lite, because guess whose parks we also see here?
- This is the category for the smaller Disney and Universal parks – Hong Kong Disneyland, Euro Disney. Maybe Universal Studios Singapore.
- Through publicly available information we cannot know for sure, but given the dispersion of their attendance, it is probable that the one or two largest Cedar Fair, Six Flags, and Seaworld operations are in this range.
- The characteristics of these theme parks are also similar to the first Disney/Universal category: high development spend, and/or first-mover advantage when land costs were low. Hong Kong Disneyland famously spent more than $4 billion to open by 2005, and Euro Disney spent almost as much in the early 1990s.
- And once again, first mover advantage is inherent: the first Seaworld and Six Flags attractions were built in the 1960s and 1970s, before land prices in most North American markets showed hockey stick trajectories. Cedar Point (Cedar Fair) has been sitting on the same land since 1870.
Tier 2
Between $100 million and $350 million, this tier includes most of the parks belonging to the regional operators – Cedar Fair, Six Flags, and Seaworld, and includes the largest parks in developed countries outside of the United States.
- Samsung Everland is the largest theme park in Korea in size and attendance. Tivoli Gardens in Denmark, Ferrari World in Abu Dhabi, Futuroscope in France, and according to our estimates, Europa Park in Germany as well as Blackpool in England are likely at the upper edge of this tier, flirting with the lower edge of the Star Performer category.
- The higher performing Legoland park(s) are also in this category.
- One difference from the previous Tier 1, is that the largest waterparks are likely in this category; i.e., those getting over 1 to 1.5 million in attendance. This is only a handful of names.
The key takeaway here is a simple probabilistic one. It is much more likely that any new large park development falls into this category, between $100 million to $350 million range. Unless you are Disney or Universal.
The Supermajority
Most theme parks in the world generate less than $100 million in revenues. This is the largest category and includes most of the waterparks in the world, most (all?) indoor theme parks, and regional ride parks.
Clients sometimes have an adverse reaction against being placed in this category, without considering that what actually matters in a real estate development is whether you see a return on your investment.
I.e, would you rather run a $10 million park that returns 30% every year, or have a four billion dollar park that has not made money for decades?
- Merlin Entertainments famously operates dozens of midway attractions fitting into this category, with a high double-digit IRR. Indoor parks such as Kidzania can be very profitable, seeing immediate or even pre-opening returns on their investment from multiple revenue streams, such as sponsorship.
- Overall, the profitability of smaller parks is probably higher. In certain regions, such as Asia/Southeast Asia, the ticket price to get into a waterpark is on par with, if not higher than, the ticket price for a theme park.
- Exhibits A & B: Consider that in 2016, Samsung Everland had a headline adult price of 58,000 KRW against a 74,000 KRW peak price for Caribbean Bay, its associated waterpark. At Chimelong Paradise, the comparison was 250 RMB and 300 RMB, respectively. These two are the highest attended waterparks in Asia.This, while waterparks generally have capex requirements that are a fraction of that of a theme park.
Revenue Wrap-Up
The actionable response to this analysis of revenues can be distilled into a few questions, as below:
- What revenue segment can you feasibly target?
- What makes you think that you will be in any category aside from the Supermajority, where 90%+ of the parks of the world are? By spending more? This is not to say that it is impossible. Just that it is necessary to really construct your case carefully.
- If you are aiming high, then first, contact us. Second, do you have the resources to build a billion dollar park? Or, can you get the local government to subsidize you?
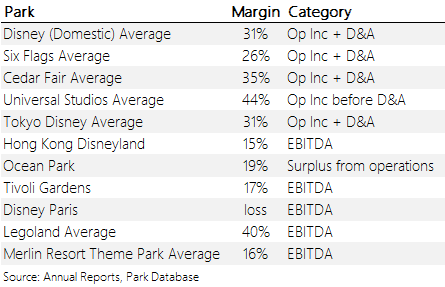
Profitability
Once you target your revenue figure, whether through a calculated or dart-throwing approach, now it’s time for profits.
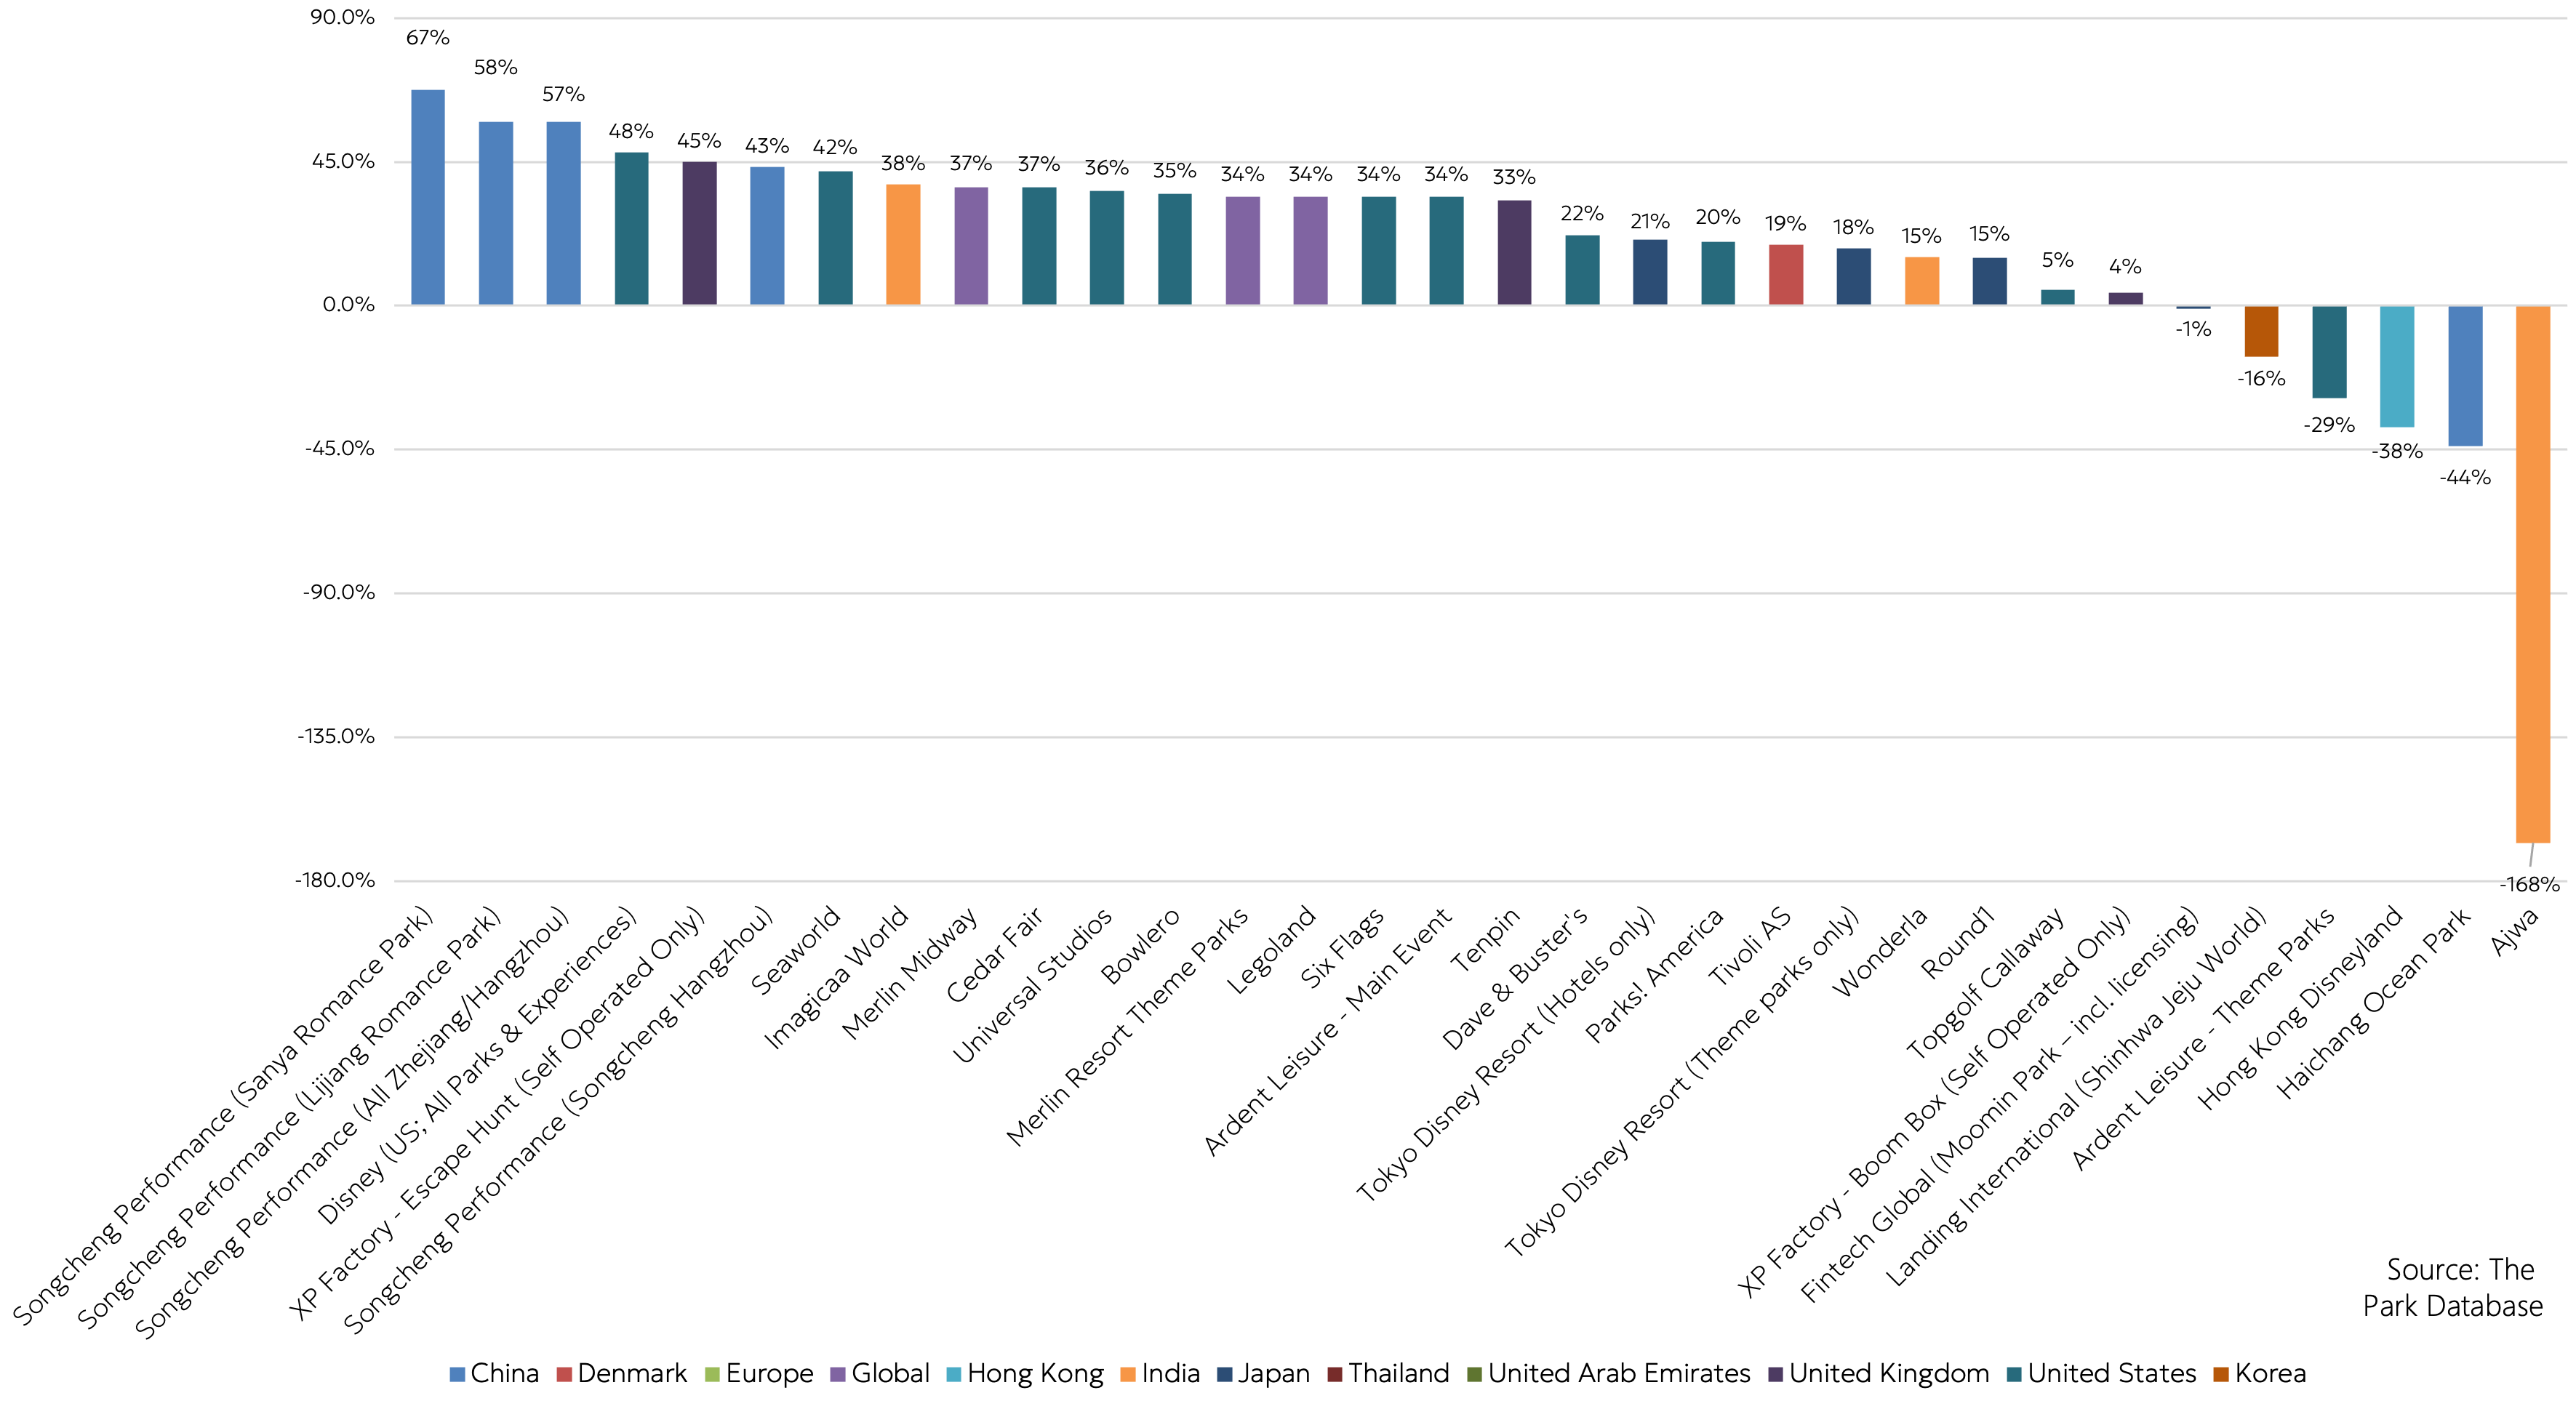
This part is relatively easier, because empirically, it seems that EBITDA margins at successful parks, regardless of their size, seem to be constrained in a tighter range of between 20-40%.
2024 update: here’s an updated chart of 2022 values and across a wider array of park types (including smaller operations).
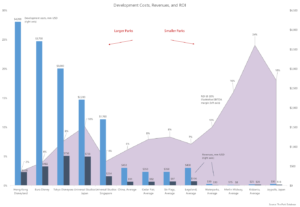
Summary Framework
To do a simple analysis, the three metrics that are important in evaluating theme park economics are:
- Topline Revenues
- Profit Margin
- Development Cost
If that seems laughably simple that’s because it is.
The planning process should then be approached by trying to find the right range of these measures in themselves, and then calibrating these three measures with each other. I.e., how feasible is it to achieve those revenues in the first place, what do you need to spend to target those revenues, how feasible is it to achieve a given profit margin, etc.
Here are some back of envelope examples.
I’m Disney/Universal:
- How feasible is it to suck $1 billion in revenues out of the market?
- Can I hit about $300 million in EBITDA?
- Given $300 million in EBITDA, what can I afford to spend? Who can I hit up for money? How much in government incentives can I get?
- Given how much I can afford to spend, what is the sensitivity of returns to a 25% swing in revenues, either way?
I will be a super-regional park:
- How feasible is it to coax $350 million in revenues out of the market? This is at the upper range of revenues for any theme park, so how will I hit this?
- How will I differentiate the park from what’s in the market now?
- Given the cost structure, how feasible is $100 million in EBITDA?
- With $100 million in EBITDA, what can I afford to spend?
- Given what I can spend, can I build a park that is on par with the best theme parks in the world?
- Given how much I can afford to spend, what is the sensitivity of returns to a 25% swing in revenues, either way?
I’m an indoor attraction:
- How feasible is it to generate $15 million in revenues in this market? How do I position myself in an area of maximum traffic?
- Given the cost structure, how feasible is $5 million in EBITDA?
- Given this, what can I afford to spend? Is there a mall developer I can partner with?
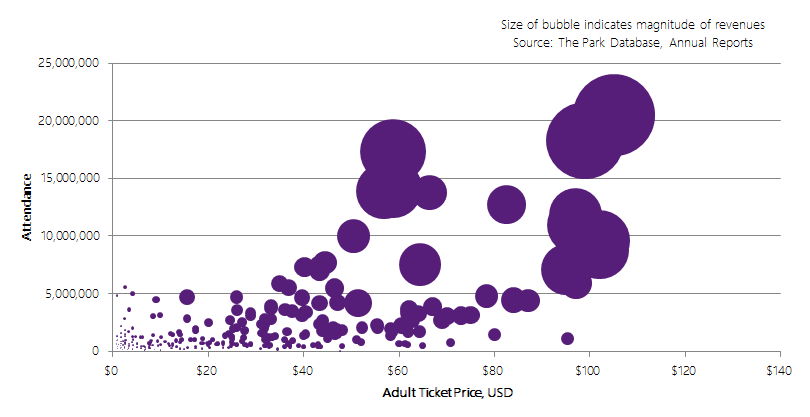
Lastly, we want to leave you with the following chart. One of the corollaries to the power-law revenue distribution is that seemingly, the higher the attendance at a theme park, the higher the ticket price! Of course, this may not actually be the case because we are not comparing like-for-like items. A stay at a Disney or Universal park is not the same as spending two hours in an FEC.
Rather, what this chart reinforces is that the theme park industry is a cumulative advantage industry: scale and first-mover advantage matters.

This is a brief introduction to lay the foundation of later posts, but it is our hope that you’ve found it useful.
Part II, relating to costs and investment returns, is here.
Part III, relating to funding sources, is here.
Part IV, relating to the composition of revenues (attendance and per capita expenditures), is here.
If you’re ready, develop your own models using the same template we use.